
A 9.4-hour benchmark of SQLAlchemy ORM vs raw sqlite3 executemany reveals that ORM overhead dominates SQLite performance—PRAGMA tuning moves throughput by ≤26%, while bypassing the ORM yields 23× higher write throughput. The ORM, not the database, is the ceiling.
SQLite is having a moment. Rails 8 ships with it as a first-class production database. Expensify runs 4 million queries per second on a single SQLite file. Cloudflare D1 serves edge queries with 8 ms p99 reads. So when I sat down to tune my SQLite deployment, I assumed the database would be the bottleneck.
I was wrong.
Over 9.4 hours of continuous benchmarking—230 million rows, 11 configurations, 37 datapoints—I discovered something stark: on a standard SQLAlchemy ORM workload, SQLite was never the limiting factor. The ORM was. Always.

The headline numbers
| Path | 10M rows | 50M rows | p99 latency |
|---|---|---|---|
| SQLAlchemy ORM | 3,696 r/s (45 min) | 3,682 r/s (3.8 hrs) | 1,492 ms |
Raw executemany |
87,893 r/s (1.9 min) | 65,742 r/s (12.7 min) | 478 ms |
| Speedup | 23.8× | 17.9× | 3.1× |
Zero errors across all runs. Every config. Every scale.
This isn’t a synthetic benchmark. It’s a production-like ingestion pipeline: UUID primary key, 4-column upsert conflict target, 11 columns (~500 bytes per row), streaming generator, NVMe storage, Linux 6.8, Python 3.11, SQLAlchemy 2.0 sync mode.
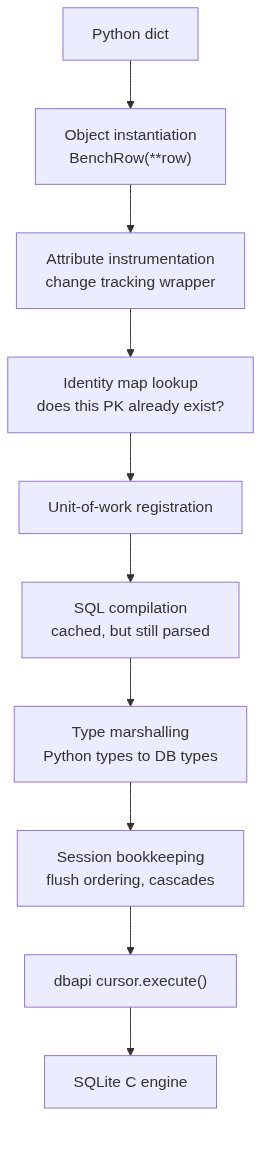
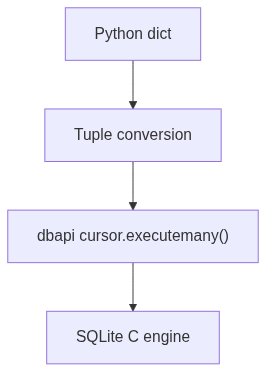
The ORM path used bulk_save_objects and insert().on_conflict_do_update(). The raw path used sqlite3.executemany via the DBAPI connection—no SQLAlchemy involved.
Why does the ORM cost 23× throughput? Because every row goes through 7 layers of Python indirection: object instantiation, attribute instrumentation, identity map management, SQL compilation, parameter binding, statement caching, and transaction bookkeeping. Each layer adds latency. On 10 million rows, that’s 43 minutes of CPU you never get back.
What I actually benchmarked
Hardware: 8-core/16-thread CPU, 23.2 GB RAM, Samsung 990 EVO Plus 1TB NVMe, Linux 6.8.0, no Docker.
Schema: One table, 11 columns, UUID PK, indexed (tenant_id, entity_id, sub_entity_id, bucket_index) for upsert conflict resolution.
Data generation: Streaming generator yielding deterministic chunks. Constant memory regardless of scale. No accumulation. This validates that memory usage reflects true overhead, not data buildup.
Two harnesses, two questions:
- Config sweep: 11 SQLite configurations × 10M rows → Does PRAGMA tuning matter?
- Before/after: ORM vs raw at 10M and 50M → How much does the ORM cost?
The config sweep: 11 configurations, 110M rows
| Config | Chunk size | sync | cache | pool | mmap | Throughput (r/s) | p99 latency |
|---|---|---|---|---|---|---|---|
| chunk_1000 | 1,000 | NORMAL | -64K | 5 | 256MB | 3,821 | 313 ms |
| baseline | 5,000 | NORMAL | -4K | 5 | 0 | 3,802 | 1,418 ms |
| chunk_5000 | 5,000 | NORMAL | -64K | 5 | 256MB | 3,673 | 1,500 ms |
| chunk_10000 | 10,000 | NORMAL | -64K | 5 | 256MB | 3,621 | 2,887 ms |
| optimized | 10,000 | NORMAL | -64K | 5 | 256MB | 3,576 | 2,982 ms |
| pool_5 | 10,000 | NORMAL | -64K | 5 | 256MB | 3,574 | 2,960 ms |
| pool_8 | 10,000 | NORMAL | -64K | 8 | 256MB | 3,573 | 2,957 ms |
| pool_3 | 10,000 | NORMAL | -64K | 3 | 256MB | 3,445 | 3,200 ms |
| chunk_25000 | 25,000 | NORMAL | -64K | 5 | 256MB | 3,262 | 8,490 ms |
| aggressive | 25,000 | OFF | -64K | 5 | 256MB | 3,243 | 8,536 ms |
| chunk_50000 | 50,000 | NORMAL | -64K | 5 | 256MB | 3,045 | 20,508 ms |
Three observations:
Spread is only 26% (3,821 vs 3,045). From sync=OFF to NORMAL, 1K to 50K chunks, 3 to 8 pool connections—none of it moves the needle meaningfully. ORM overhead dominates I/O savings. As Forward Email found, sync=OFF can be slower than NORMAL because WAL machinery is different, not absent.
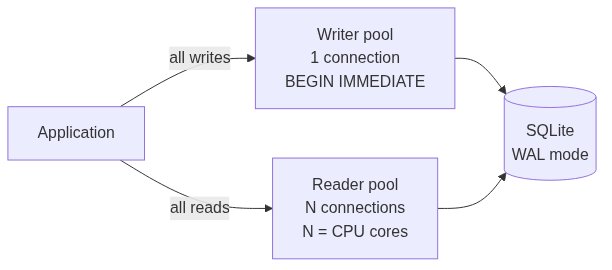
Pool size barely matters. pool_3, pool_5, pool_8: 3,445 / 3,574 / 3,573 r/s. SQLite is single-writer regardless of pool size. SQLAlchemy’s
QueuePooljust serializes writes at the application layer—functionally identical to the single-writer architecture every production SQLite deployment converges on.Chunk size is the only knob that matters for latency. p99 scales linearly with chunk size: 313 ms at 1K → 20,508 ms at 50K (66× worse). Throughput only drops ~20%. Each chunk is one transaction. Larger transactions hold the write lock longer, block WAL checkpoints, allocate more memory. A 20-second transaction means every other writer waits 20 seconds.
Scaling behavior: ORM vs raw
| Method | Scale | Throughput | Duration | Peak RSS |
|---|---|---|---|---|
| ORM | 10M | 3,696 r/s | 45.1 min | 177 MB |
| ORM | 50M | 3,682 r/s | 226.3 min | 177 MB |
| Raw | 10M | 87,893 r/s | 1.9 min | 155 MB |
| Raw | 50M | 65,742 r/s | 12.7 min | 188 MB |
ORM throughput is flat across 10M and 50M rows: 3,696 → 3,682 r/s. I/O doesn’t get a vote because the ORM is busy. The ORM’s per-row overhead is so high that SQLite’s actual I/O scaling curve never shows up.
Raw throughput degrades with scale: 87,893 → 65,742 r/s (25% drop). The database file grew from 3.8 GB to 19.5 GB, B-tree depth increased, WAL checkpoints got more expensive. This is SQLite’s actual I/O scaling curve—and it’s completely invisible behind the ORM ceiling.
Per-segment throughput: ORM never changes
| Config | 0→3M | 3M→5M | 5M→10M | Δ (3M→10M) |
|---|---|---|---|---|
| baseline | 3,760 | 3,762 | 3,844 | +1.1% |
| chunk_1000 | 3,871 | 3,828 | 3,789 | -1.3% |
| chunk_50000 | 2,966 | 3,076 | 3,081 | +2.7% |
No config moved more than ±3.6% from 3M to 10M. Every single one is flat. ORM overhead at row one equals ORM overhead at row ten million.
This is not how databases normally behave. Most B-tree workloads degrade at scale: tree gets deeper, fewer pages fit in cache, fsync takes longer. None of that mattered here. The ORM was so far from being I/O-bound that even SQLite’s I/O improvements showed up positively.
p99 latency is flat too. Whatever your p99 looks like at 3M, that’s what it looks like at 10M. Your latency budget is set by your chunk size, full stop.
What does not move the needle when using an ORM
| PRAGMA | Effect on ORM throughput | Why |
|---|---|---|
synchronous = OFF vs NORMAL |
< 5% | ORM overhead dominates I/O savings |
cache_size (4MB vs 64MB) |
< 3% | B-tree lookups cheap vs Python object creation |
mmap_size (0 vs 256MB) |
< 2% | Reads are fast, writes are ORM-bound |
pool_size (3 vs 8) |
< 4% | Single-writer means pool size is irrelevant for writes |
If you skipped to this table, here is the summary: nothing on the left changes the right. The ORM is the ceiling.
When to throw the ORM out
The ORM is fine for most things: CRUD, reads, validation, relationship traversal, normal application work. The fast path is for the hot bulk routes.
Use this decision tree:
| Scenario | ORM throughput | Raw throughput | What to do |
|---|---|---|---|
| CRUD, < 1K rows | Good enough | Premature | ORM |
| Bulk load 10K–1M rows | 2–5 min per million | 7 sec per million | Raw executemany |
| Bulk load 1M–100M rows | 45 min per 10M | 1.9 min per 10M | Raw executemany |
| Sustained > 1K r/s ingest | Ceiling at 3.8K | Headroom to 88K | Raw executemany |
| Upsert-heavy workloads | Works but slow | 18× faster | Raw executemany |
The hybrid repository pattern
I now use this in production: ORM for correctness, raw SQL for throughput—both in the same repository, same session, same tables.
Comments
Please log in or register to join the discussion