Discover how to transform chaotic telemetry flows into streamlined pipelines using OpenTelemetry Collector. Learn to collect, enrich, and route observability data with vendor-neutral control while unlocking advanced processing capabilities. This guide takes you from basic ingestion to production-grade deployment patterns.
Building Robust Telemetry Pipelines with OpenTelemetry Collector
Modern applications generate torrents of telemetry data—traces, metrics, and logs—but traditional approaches often create vendor lock-in and management nightmares. The OpenTelemetry Collector provides a revolutionary solution: a vendor-neutral pipeline architecture that transforms how we handle observability data.
The Pipeline Revolution
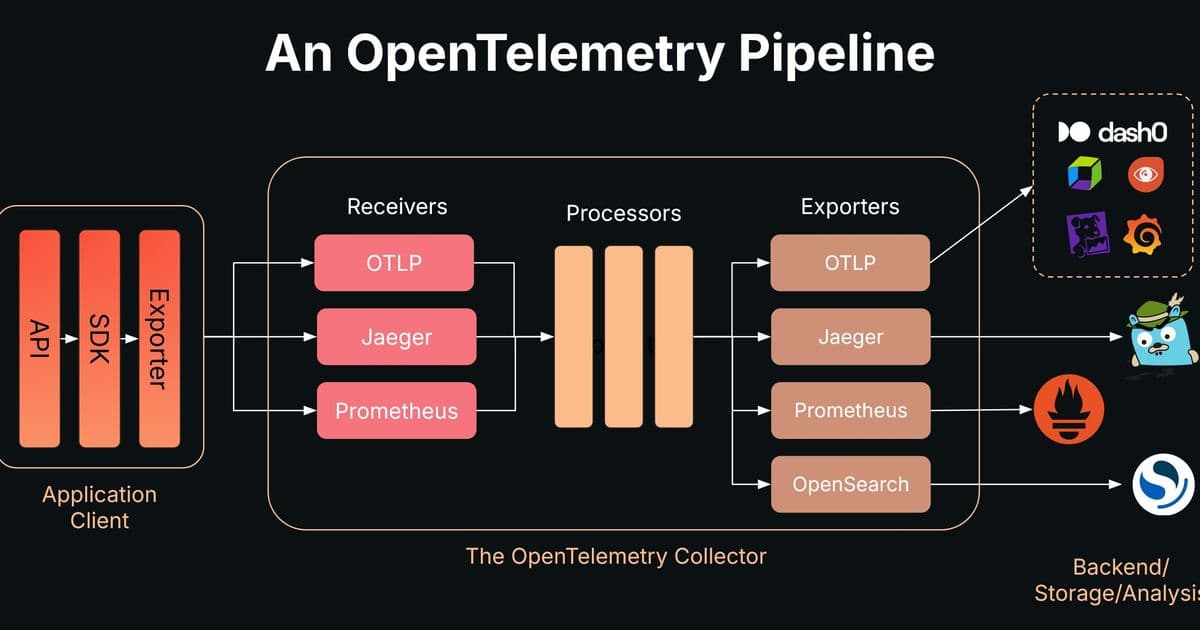
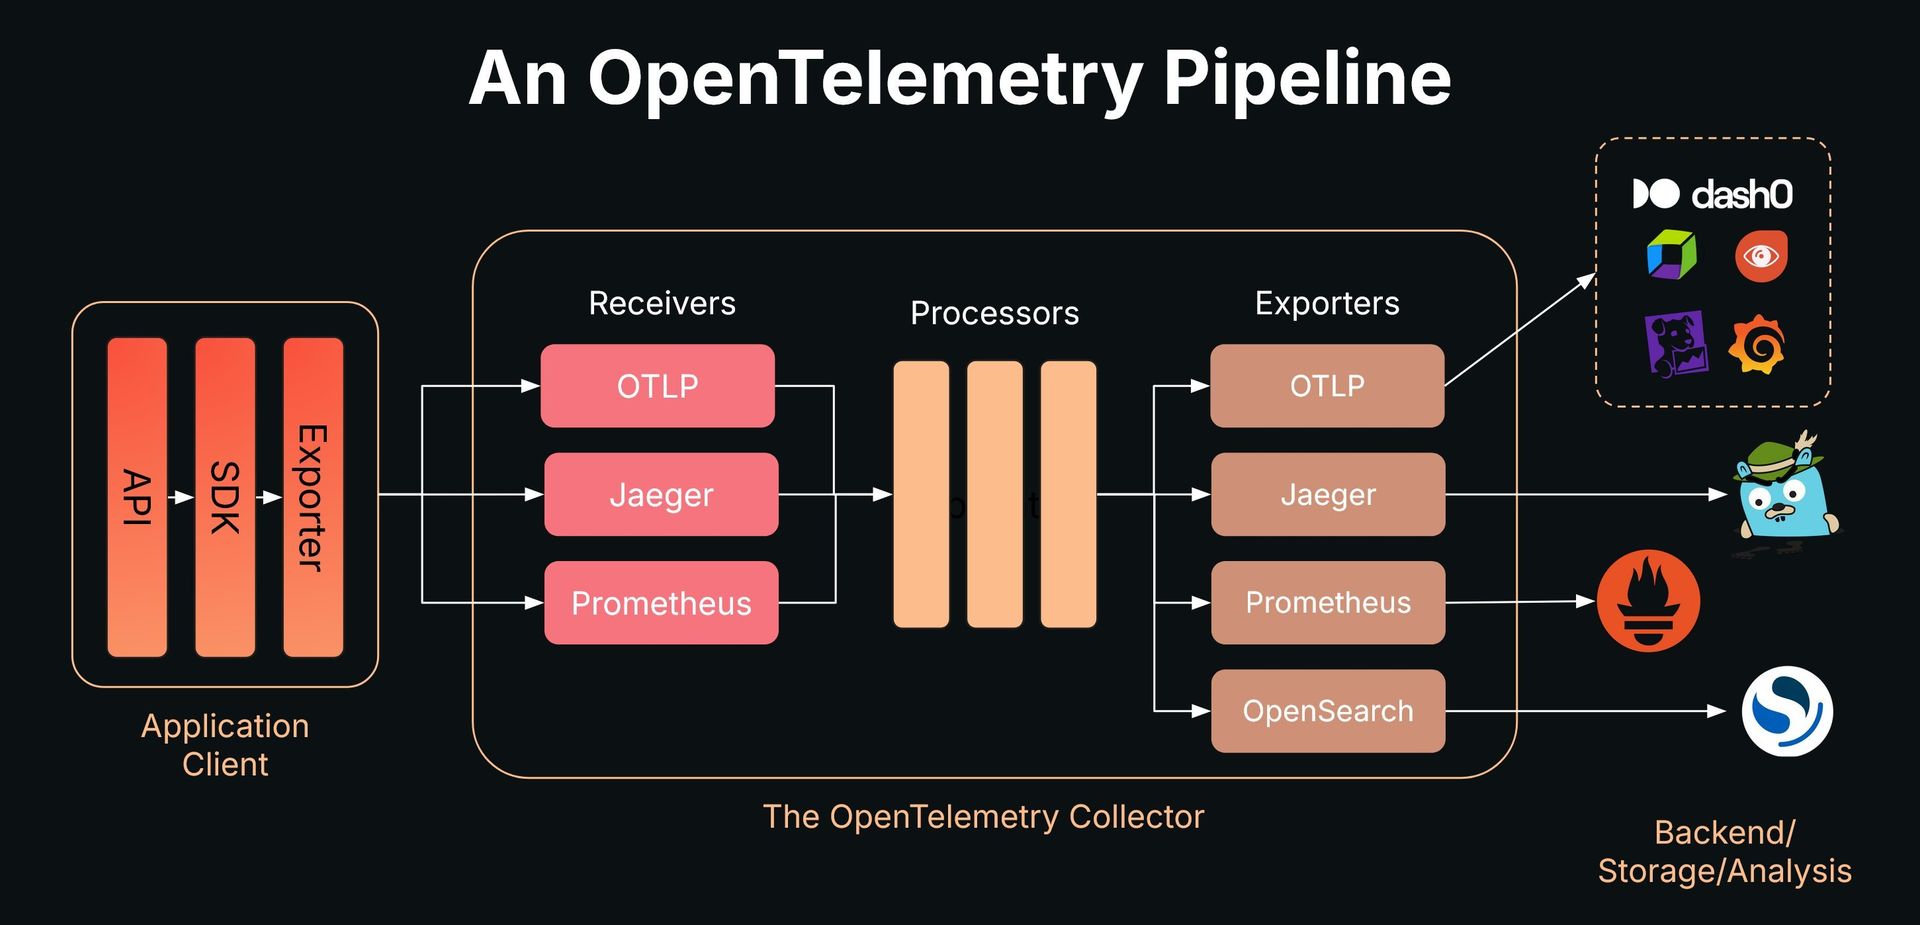
Instead of managing point-to-point integrations and proprietary agents, the Collector acts as a universal processing hub. It receives data through receivers, processes it through customizable processors, and routes it to backends via exporters—all defined in a single YAML configuration:
receivers:
  otlp:
    protocols:
      grpc:
        endpoint: 0.0.0.0:4317

exporters:
  debug:
    verbosity: detailed

service:
  pipelines:
    logs:
      receivers: [otlp]
      exporters: [debug]
Processing Superpowers
Essential Processors
- Batching: Group data for efficient transmission
- Filtering: Drop noise with OTTL expressions (e.g.,
severity_number < SEVERITY_NUMBER_INFO) - Transformation: Fix malformed data using the powerful transform processor:
processors:
  transform:
    log_statements:
      - context: log
        statements:
          - set(trace_id, attributes["trace_id"])
          - delete_key(attributes, "trace_id")
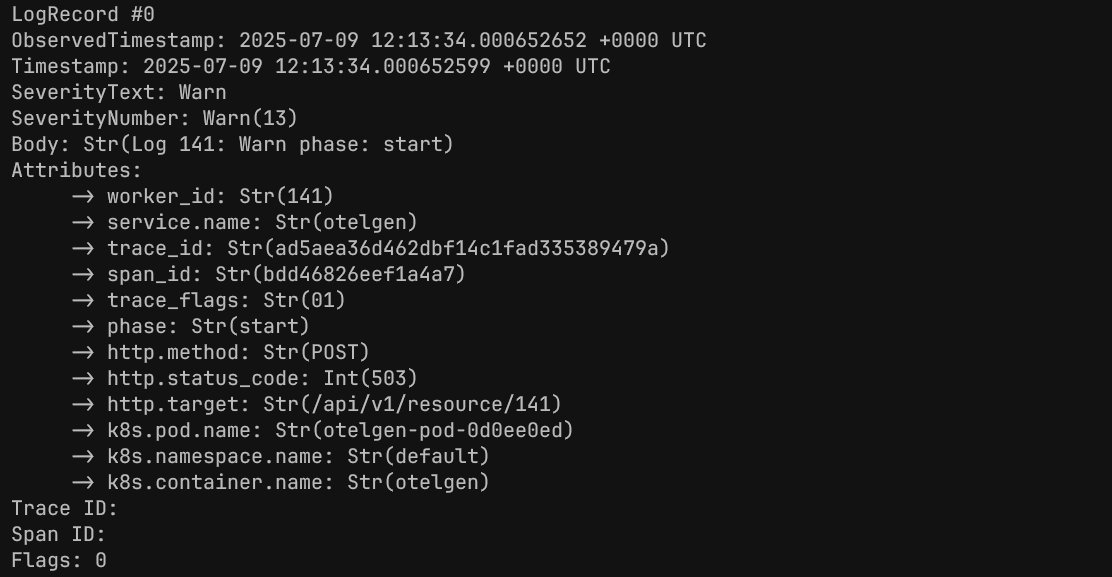 Transforming log records to comply with OpenTelemetry standards
Resilience Engineering
processors:
  memory_limiter:
    check_interval: 1s
    limit_mib: 400
    spike_limit_mib: 100
The memory limiter prevents crashes during traffic spikes by enforcing backpressure—critical for production reliability.
Advanced Architectures
Multi-Signal Pipelines
Handle logs, traces, and metrics simultaneously with parallel pipelines:
service:
  pipelines:
    logs:
      receivers: [otlp]
      processors: [memory_limiter, transform, batch]
      exporters: [debug, otlphttp/dash0]

    traces:
      receivers: [otlp]
      processors: [batch]
      exporters: [otlp/jaeger]
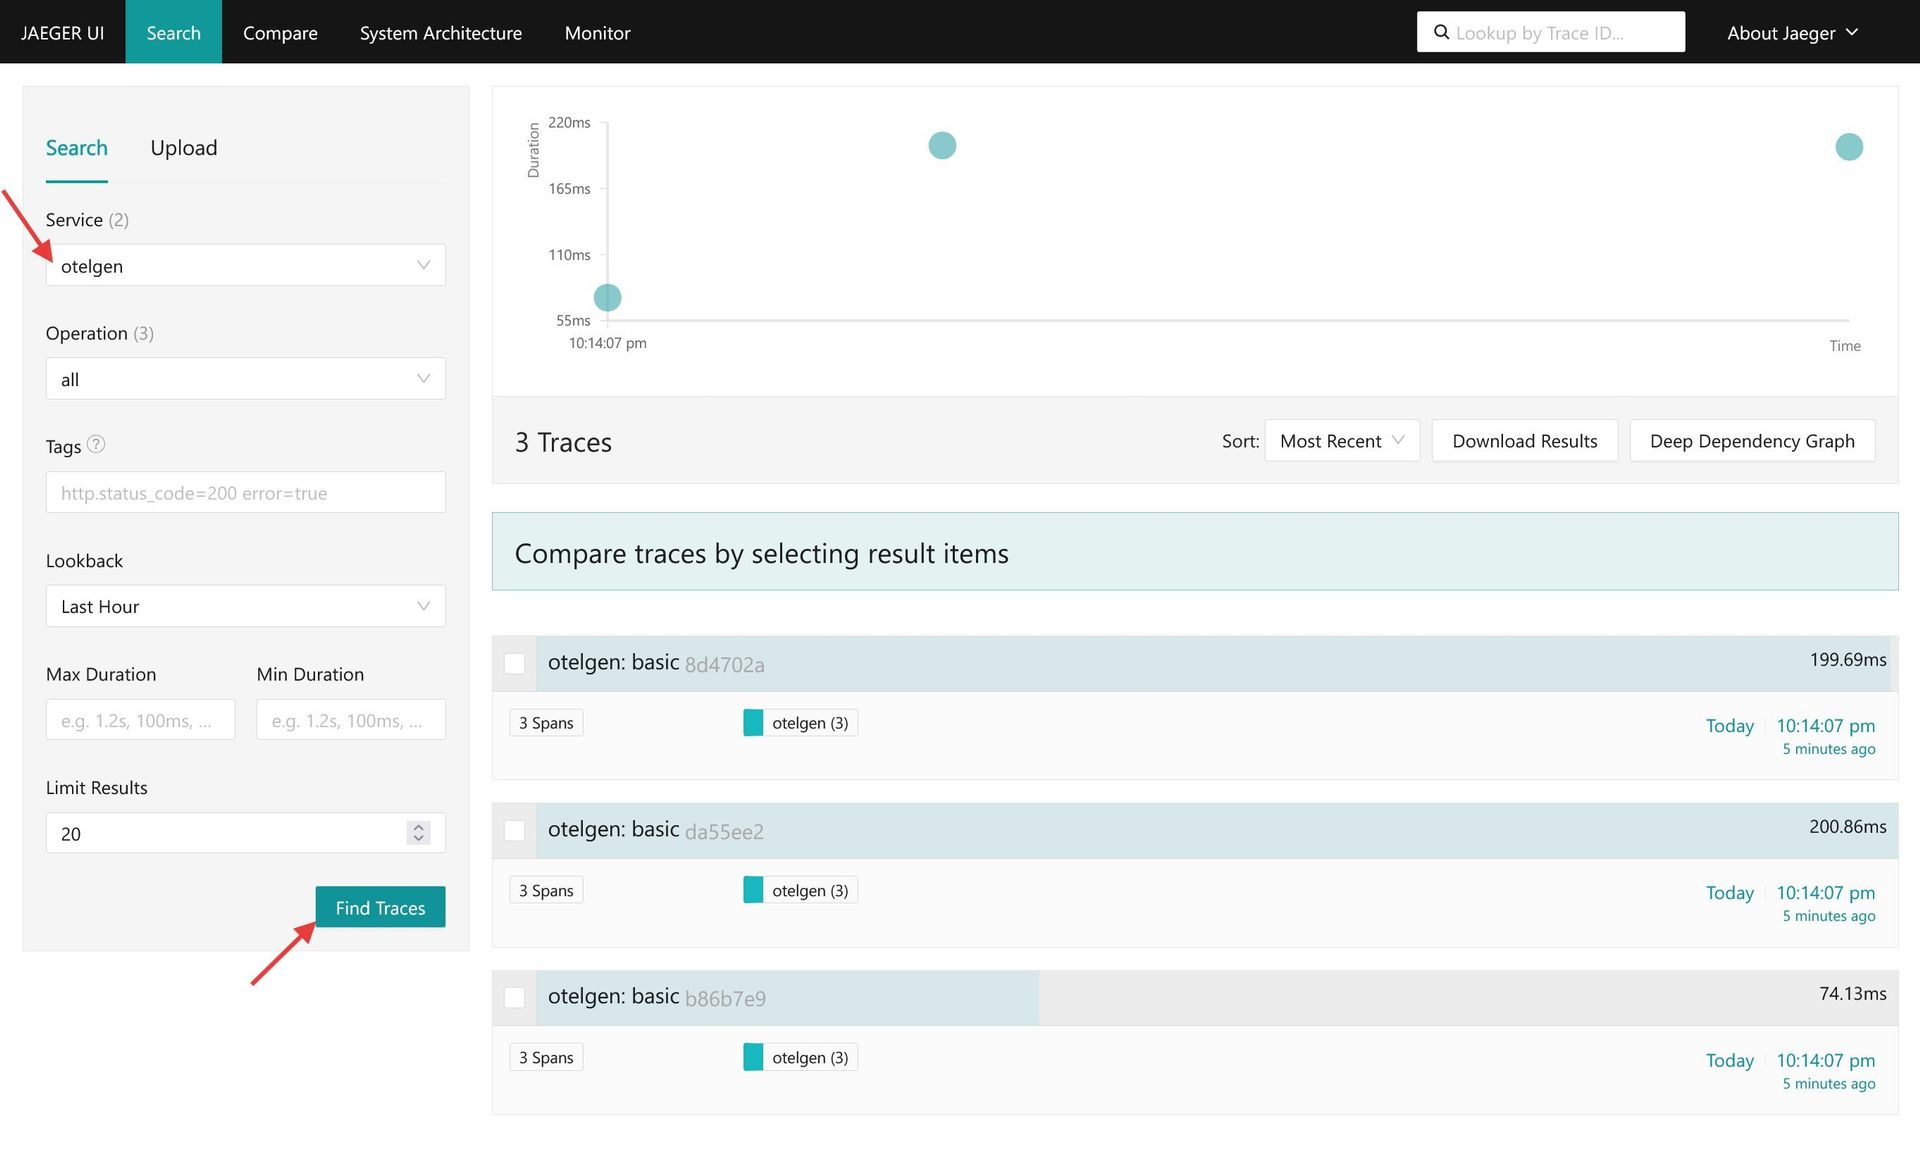 Viewing generated traces in Jaeger UI
Connectors: The Game Changer
Generate new telemetry from existing data:
connectors:
  count/log_errors:
    logs:
      log_error.count:
        conditions:
          - severity_number >= SEVERITY_NUMBER_ERROR
This creates metrics from log data without application changes—enabling powerful derivatives like RED metrics from traces.
Production Deployment Patterns
- Agent-Only: Simple but lacks durability
- Agent + Gateway: Centralized processing with backpressure handling
- Queue-Based: Kafka buffer for massive scale and guaranteed delivery
Application → Collector Agent → Kafka → Collector Aggregators → Backends
Why Pipelines Win
- Cost Control: Filter noise before it hits expensive backends
- Vendor Freedom: Switch observability tools without redeploying
- Security: Scrub PII at the pipeline layer
- Innovation: Derive new insights via in-stream processing
 Evolution from basic to advanced pipeline architecture
OpenTelemetry Collector transforms telemetry from operational overhead to strategic asset. By mastering pipelines, you gain unprecedented control over your observability ecosystem.
Source: Adapted from Dash0's OpenTelemetry Collector Guide
Comments
Please log in or register to join the discussion