
New research analyzing 12,000 developers reveals that cycle time—the go-to metric for engineering productivity—is so inherently variable that individual snapshots are meaningless. Instead, improving software velocity demands system-level interventions, not blame or praise for developers, as factors like task scoping and defects create unavoidable noise in the system.
Software engineering is inherently chaotic. Requirements shift like sand, dependencies crumble without warning, and the mythical "10x developer" often feels like a distraction from the real work. Yet, management craves clean, upward-trending graphs to gauge productivity. For years, cycle time—the duration from ticket opening to closure—has been championed as a silver bullet. But a groundbreaking study of nearly 12,000 contributors across 200+ organizations shatters this illusion, revealing why obsessing over individual metrics is not just futile, but counterproductive.
The Seductive Simplicity of Cycle Time
At first glance, cycle time seems logical: shorter cycles mean faster delivery, more experiments, and happier customers. Tools like DORA metrics have refined its measurement, promising correlations with business outcomes. But as the paper, "No silver bullets: Why understanding software cycle time is messy, not magic," underscores, this simplicity masks a turbulent reality. Software development is riddled with unpredictability—security vulns, shifting priorities, and the ever-present "Patch Tuesday" fallout. Cycle time data, the researchers found, is drowned in noise, with individual performance fluctuating so wildly that month-to-month comparisons are statistically meaningless.
"Improving software delivery velocity likely requires systems-level thinking rather than individual-focused interventions," the authors conclude, urging a shift from blame to systemic analysis.
What Actually Moves the Needle (and What Doesn’t)
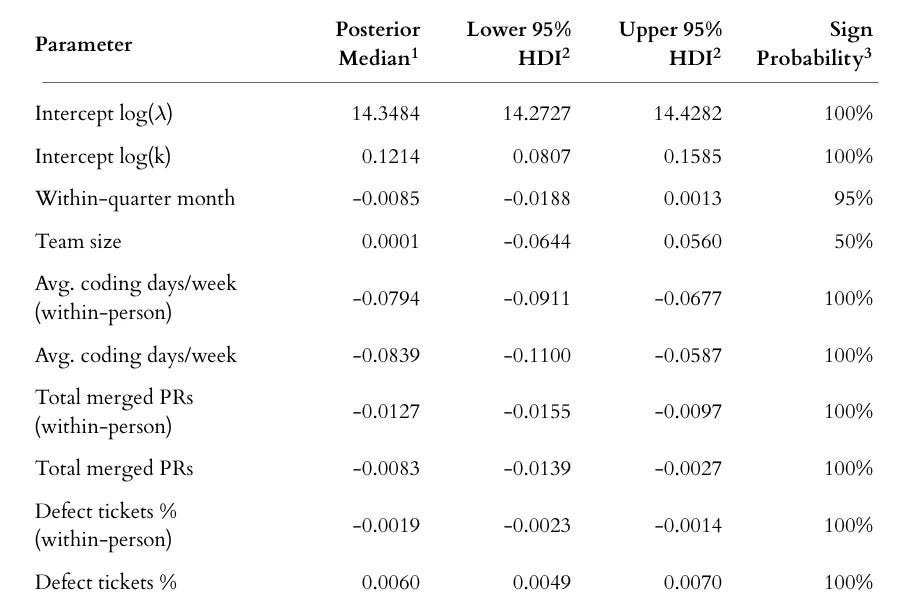
The study dissected five key factors believed to influence cycle time, using commit data and PR interactions as proxies. Here’s what the data revealed:
- Coding days (days with ≥1 commit): Reduces cycle time slightly, but measured crudely—flow time might offer better insights.
- Task scoping (total PRs merged): More PRs correlate with shorter cycles, suggesting smaller tasks help, though it could indicate undocumented work.
- Collaboration (PR comments/interactions): Deeper engagement speeds up cycles, debunking myths that reviews slow things down.
- Defects (% defect tickets): Increase cycle time predictably, as firefighting diverts focus.
- Individual variability: A developer’s cycle time in one month has almost no bearing on the next, with fluctuations dwarfing any consistent "skill" signal.
The effects were statistically significant but tiny. For instance, merging more PRs only trimmed cycle time by a median of -0.0083 units—a drop in the ocean of daily chaos. This noise isn’t laziness; it’s the nature of complex work. Untracked efforts—like refactoring or build fixes—often go unmeasured, yet they’re crucial for long-term velocity.
Embracing Variability: From Individuals to Systems
Instead of hunting for mythical high performers, engineering leaders must treat productivity like weather—predictable only in aggregate. The research advocates for:
- Team-level trend analysis: Track cycle time distributions over months, not days. Visualize bands of variability, not single data points.
- Qualitative pairing: Combine metrics with context—team retrospectives, and project post-mortems—to interpret spikes.
- Systemic fixes: Invest in automation, reduce technical debt, or streamline CI/CD pipelines. These environmental tweaks yield more than pressuring individuals.
As one developer in the study might attest, a "slow" month could mean untangling a dependency nightmare that accelerates the whole team later. The real metric of progress isn’t a tidy graph—it’s a resilient system that absorbs shocks and adapts. After all, in engineering, the only constant is change.
Source: JoT - Measuring Engineering
Comments
Please log in or register to join the discussion