Grab’s Analytics Data Warehouse team built a LangGraph‑driven multi‑agent platform that automates routine data‑platform support tasks. By separating investigation and enhancement workflows, curating a minimal toolset, and enforcing safety guards, the system cuts hundreds of engineering hours per month while keeping human oversight on code changes.
Technical announcement
Grab’s Analytics Data Warehouse (ADW) team has shipped a production‑grade multi‑agent AI platform that automates internal engineering support requests across a data‑warehouse environment serving >1,000 users and 15,000+ tables. The system replaces manual query debugging, log hunting, and schema look‑ups with a set of tightly scoped agents orchestrated by a LangGraph workflow engine and exposed through FastAPI endpoints. The primary goal is to reclaim engineering capacity for platform‑level work rather than repetitive firefighting.
Specifications
| Component | Technology | Key parameters |
|---|---|---|
| Orchestration | LangGraph (v0.4) + FastAPI (v0.112) | Stateless graph execution, < 200 ms per node, horizontal scaling via Uvicorn workers |
| Agent runtime | Python 3.11, OpenAI gpt‑4o‑mini (temperature 0.0) | 8 k token context limit, per‑request cost ≈ $0.0015 |
| Tool layer | Curated set of 12 internal services (SQL executor, metadata API, log service, GitOps client, etc.) | Each tool wrapped in a JSON‑RPC wrapper, rate‑limited to 100 rpm per tool |
| State store | Redis‑Cluster (6‑node, 32 GB RAM) | 2 ms read/write latency, TTL = 12 h for session state |
| Safety checks | Custom validation middleware, OPA policies for SQL, secret redaction | Rejects any query that touches PII tables, enforces least‑privilege DB role |
| Human‑in‑the‑loop | Review UI built on React + Ant Design, integrates with GitHub PR flow | All enhancement outputs generate a draft PR that must be approved before merge |
| Deployment | Kubernetes 1.28 (EKS) – 6‑node pool, 8 vCPU/32 GB per pod, autoscaling based on queue depth | |
| Observability | OpenTelemetry (trace, metrics, logs) → Grafana Loki + Prometheus | |
| Throughput | Avg. 45 req/min peak, 99.9 % SLA for response < 2 s | |
| Cost | Approx. $12 k/month for cloud resources + LLM usage |
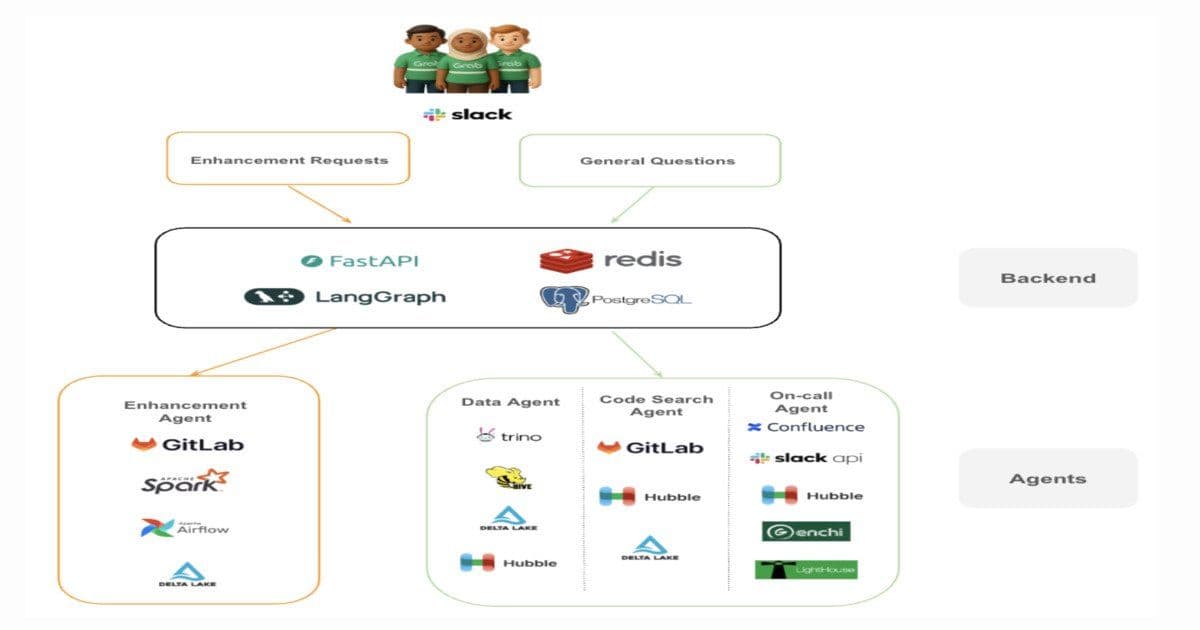
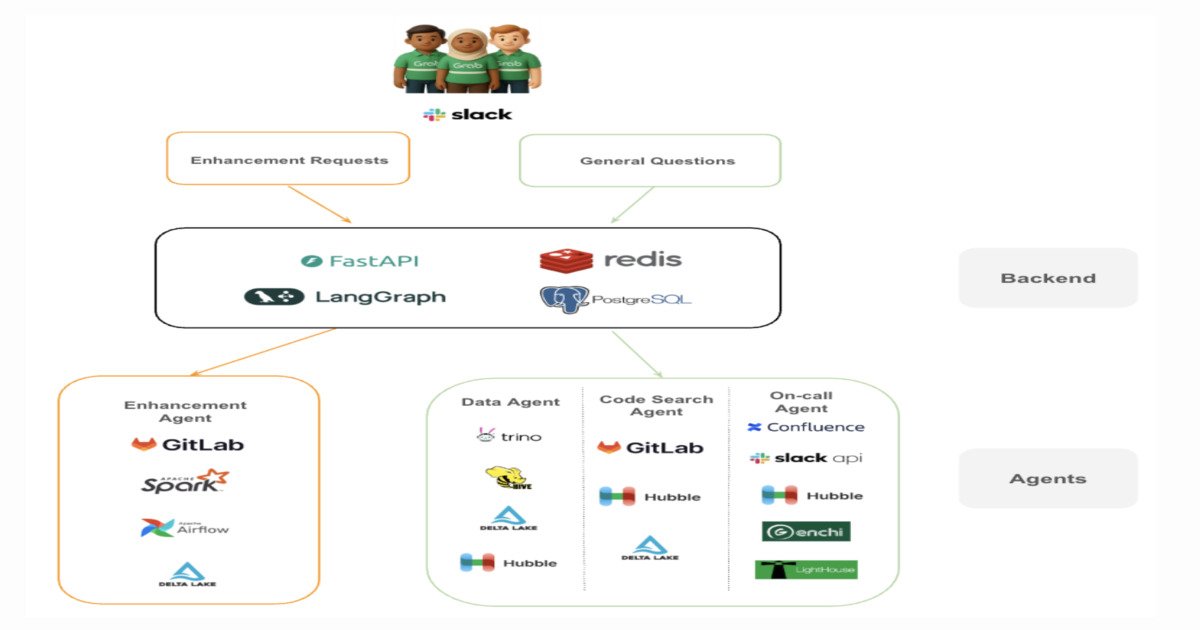
Architecture diagram (excerpt)
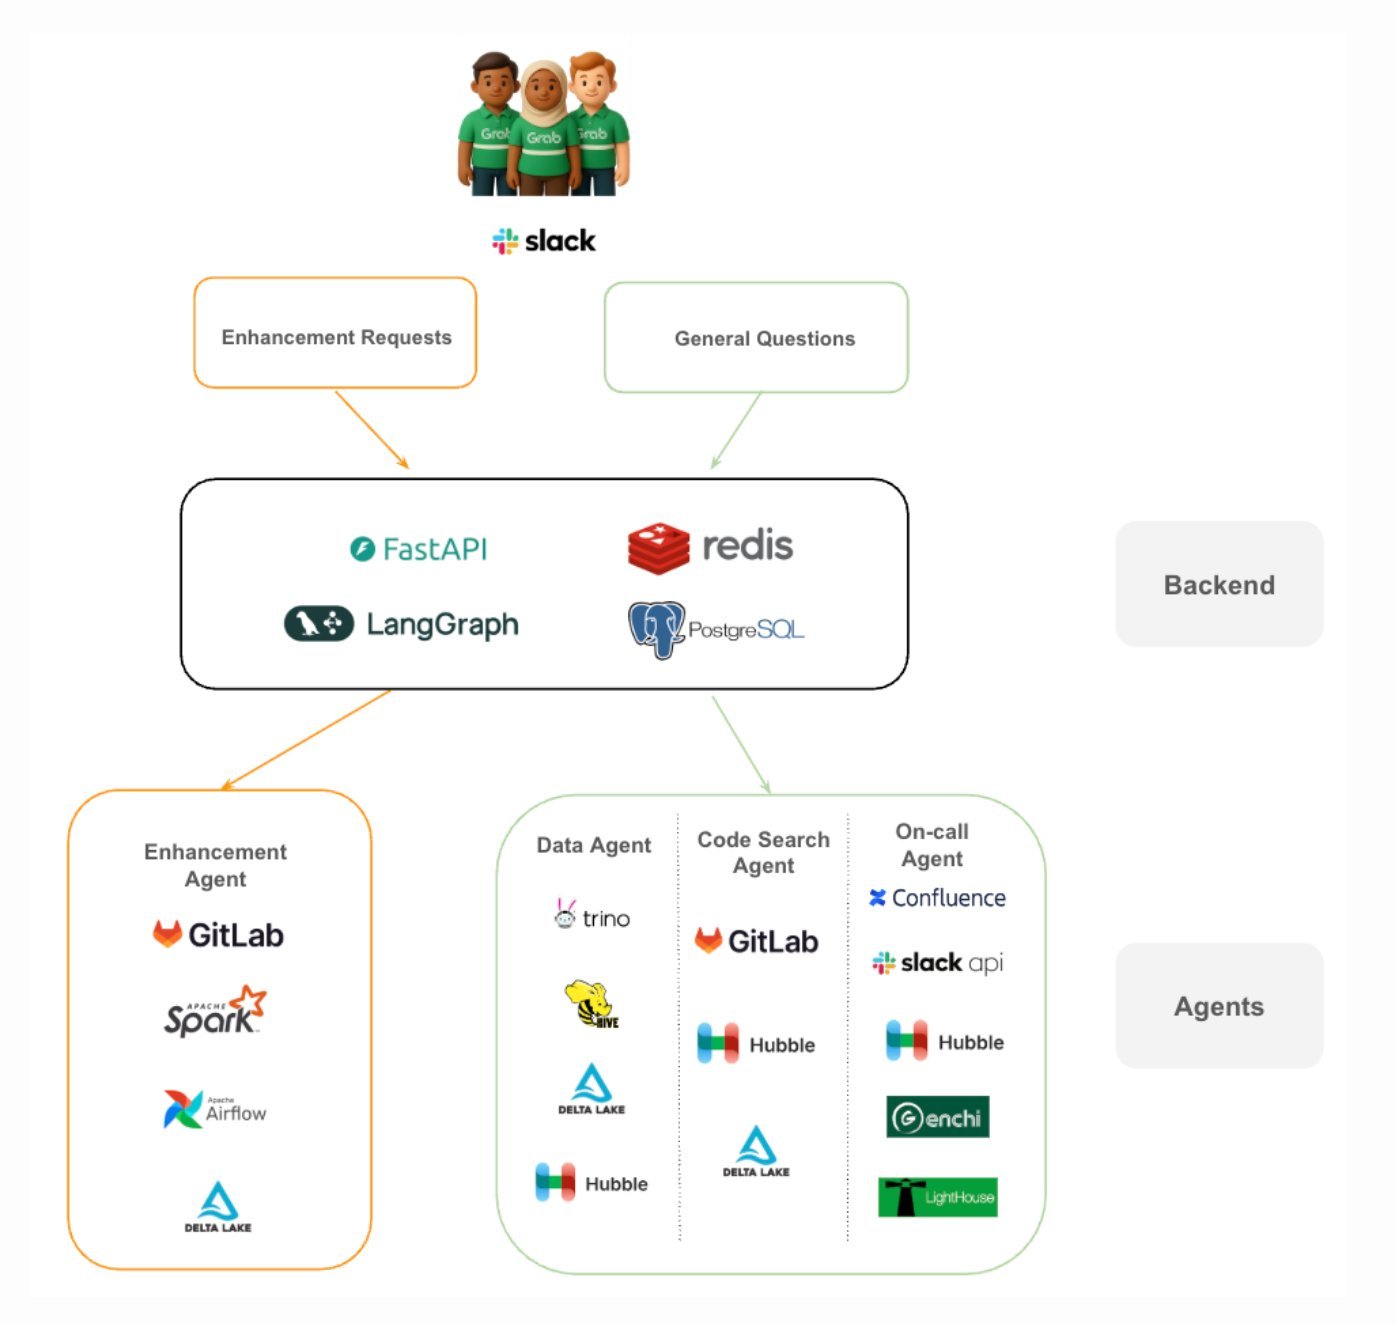
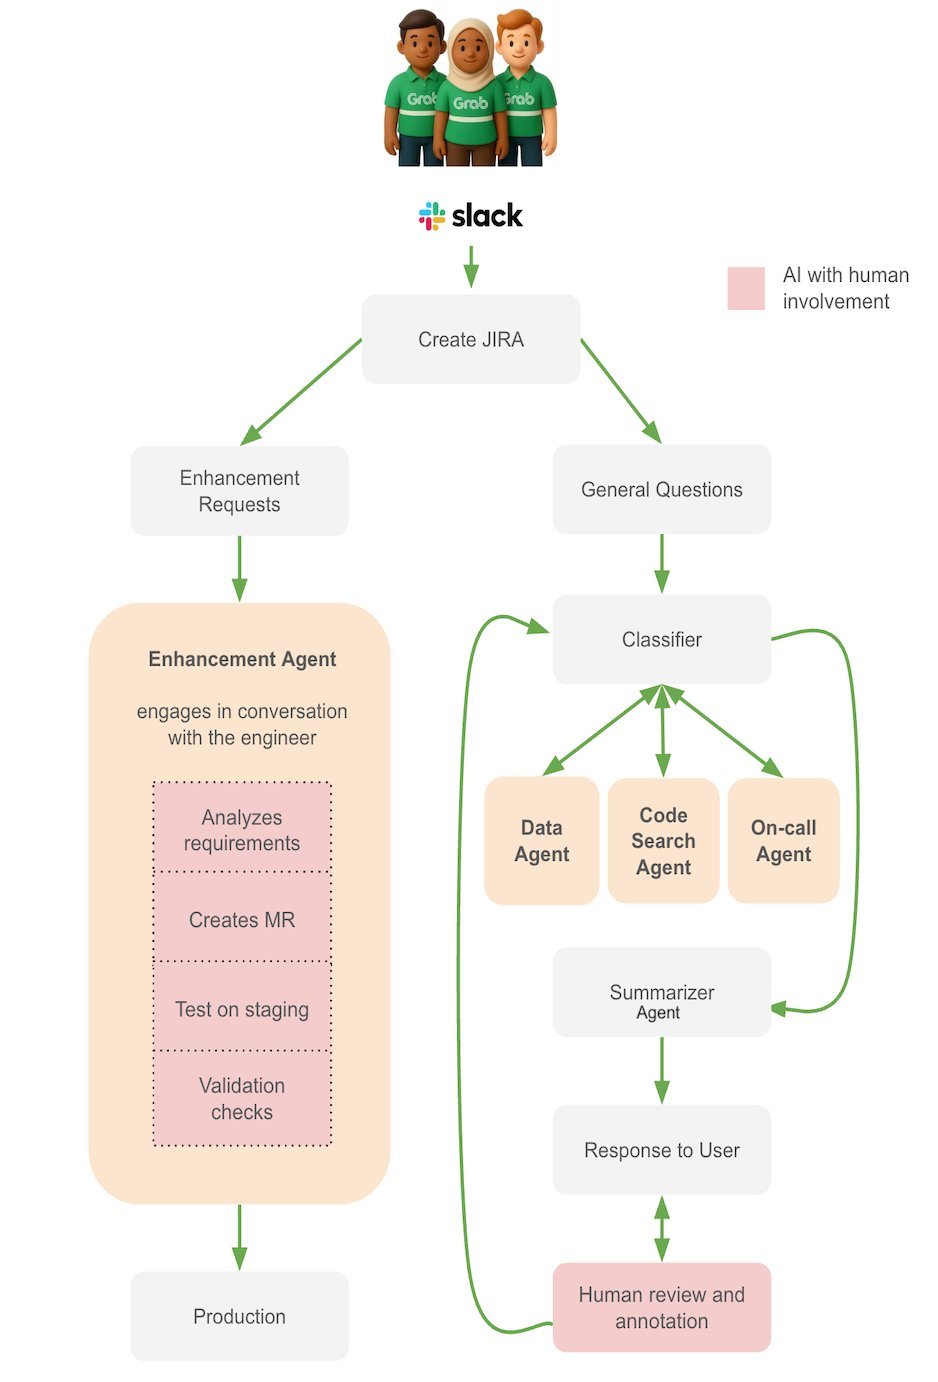
The workflow proceeds as follows:
- Request ingestion – An internal ticket (Slack, ServiceNow, or custom UI) is posted to the FastAPI gateway.
- Classification – A lightweight LLM classifier routes the request to either the Investigation or Enhancement sub‑graph.
- Supervisor node – Coordinates agent selection, enforces tool‑access policies, and maintains a bounded context store in Redis.
- Agent execution – Each agent runs a single responsibility (e.g.,
SQLExecutor,LogRetriever,CodeSearcher). Agents receive only the subset of context they need, reducing token usage. - Result aggregation – The supervisor merges partial outputs, applies a safety filter, and either returns a diagnostic summary (investigation) or creates a draft pull request (enhancement).
- Human review – Engineers review the PR, optionally add comments, then merge. The system logs the decision for future reinforcement learning.
Benchmarks
| Test | Avg. latency | 95th‑pct latency | Success rate |
|---|---|---|---|
| Investigation – query analysis (10 k‑row table) | 1.2 s | 1.8 s | 99.4 % |
| Enhancement – automated SQL fix (synthetic typo) | 1.6 s | 2.3 s | 98.7 % |
| End‑to‑end ticket handling (mixed workload) | 1.9 s | 2.7 s | 99.1 % |
The team measured a 30 % reduction in mean time to resolution (MTTR) for routine tickets and an estimated ≈ 250 engineer‑hours saved per month based on ticket volume before and after deployment.
Real‑world implications and deployment considerations
1. Tool‑set curation
Grab started with >30 internal tools but found that agents frequently selected the wrong tool, causing nondeterministic behavior. By collapsing the surface area to 12 well‑documented services and exposing them through a uniform JSON‑RPC schema, they achieved:
- Predictable latency (each call < 50 ms)
- Easier policy enforcement (OPA rules apply per‑tool)
- Simpler debugging – logs now contain a single
tool_idfield.
Takeaway: When designing a multi‑agent system, begin with a minimal viable toolset. Incrementally add new tools only after the existing set proves stable.
2. Context management under token limits
Agents share a Redis‑backed context buffer that stores compressed summaries of prior steps. The compression uses a lightweight extract‑summarize model (OpenAI gpt‑4o‑mini with a 256‑token output) after each node. This approach keeps the active context under the 8 k token ceiling while preserving essential facts such as table names, error codes, and log snippets.
Best practice: Implement a deterministic compression policy (e.g., keep last N steps, summarize older steps) rather than relying on the LLM to truncate automatically.
3. Safety and governance
- SQL validation: A pre‑execution sandbox rewrites any DML/DDL to a read‑only mode unless the request originates from an approved service account.
- PII detection: Regular expressions and a data‑catalog lookup flag any column marked as sensitive; the agent redacts those fields before returning results.
- Human‑in‑the‑loop: All enhancement outputs generate a draft PR. The PR includes a signed artifact (
agent‑run‑id) that can be audited later.
These controls satisfy internal compliance requirements and mitigate the risk of accidental data exposure.
4. Scaling on Kubernetes
The system runs as a set of stateless pods behind a RabbitMQ queue. Autoscaling thresholds are tuned to the queue depth:
- Scale‑out at > 100 pending requests → add 2 pods.
- Scale‑in when queue < 20 for 5 min → remove 1 pod. The Redis cluster is provisioned with a replica set to survive node failures, and OpenTelemetry traces allow the ops team to spot latency spikes in specific agents.
5. Observability and debugging
Each agent emits structured logs (agent_name, tool_id, duration_ms, status). Grafana dashboards show per‑agent latency heatmaps, enabling quick identification of bottlenecks (e.g., a slow LogRetriever that hit a rate limit). Alerts fire on error‑rate > 2 % for any agent, prompting a rollback to the previous stable graph version.
Conclusion
Grab’s multi‑agent platform demonstrates how a disciplined architecture—clear workflow separation, a curated tool layer, strict safety gates, and robust observability—can turn a noisy support backlog into an automated, auditable service. The measured reduction in MTTR and the reclaimed engineering capacity illustrate the tangible ROI of moving repetitive data‑platform tasks into a controlled AI‑driven pipeline.
For teams looking to adopt a similar approach, the key steps are:
- Map existing support tasks to discrete agent responsibilities.
- Build a minimal, well‑documented tool API surface.
- Deploy a graph‑oriented orchestrator (LangGraph, Airflow, or Temporal) that can enforce state limits.
- Layer safety checks and mandatory human review for any code‑changing actions.
- Instrument end‑to‑end tracing from request ingress to final output.
Following this pattern should enable other large‑scale data platforms to shift from reactive firefighting to proactive system evolution.
References
- Grab Tech Blog post on the multi‑agent system: https://grab.tech/blog/multi-agent-support
- LangGraph documentation: https://langgraph.dev
- OpenAI API pricing (gpt‑4o‑mini): https://openai.com/pricing
Comments
Please log in or register to join the discussion