A deep dive into Hannah Shamji’s four‑level framework for uncovering real user needs, showing how to move from what users say to why they act, and offering concrete methods for teams to observe, diagnose, and act on authentic customer insights.
Four Levels of Customer Understanding – A Practical Guide for Designers
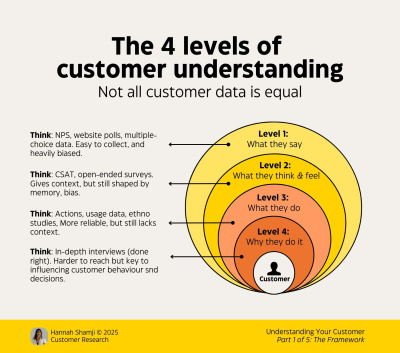
Understanding what users say, think, do, and why they behave the way they do is the cornerstone of effective UX work. Hannah Shamji’s four‑level model gives us a structured way to triangulate data, surface hidden motivations, and avoid the pitfalls of relying on surface‑level feedback.
1. What Users Say – The First Layer
Surveys, polls, and CRM notes are quick to collect, but they capture opinions more than facts. People tend to frame their answers in a socially acceptable way, or simply guess what they think the researcher wants to hear. Relying solely on this layer often leads to confirmation bias – you end up validating assumptions instead of discovering new insights.
When to use it
- Early‑stage hypothesis generation
- Contextual framing for deeper research
Pitfalls
- Over‑weighting anecdotal quotes
- Ignoring the gap between stated intent and actual behavior
2. What Users Think and Feel – Adding Context
Interviews, diary studies, and sentiment analysis give us a glimpse into users’ mental models. This layer still depends on memory, which is reconstructive rather than factual, but it adds emotional texture that pure analytics miss.
Tips for richer data
- Use think‑aloud protocols sparingly; they can disrupt the natural flow of a task.
- Apply the Emotion Wheel (see Geoffrey Roberts’ tool) to help participants label feelings beyond “good” or “bad.”
- Mirror statements and ask follow‑up questions to surface underlying concerns.
3. What Users Do – The Behavioural Core
Analytics, click‑stream data, and task‑analysis sessions reveal the concrete actions users take. This is the most reliable indicator of success or friction, because it bypasses self‑reporting errors.
Key observations to watch
- Repeated clicks or hover‑overs without action – a sign of confusion.
- Long pauses before a decision point – potential hesitation.
- Navigation loops where users return to a previous screen repeatedly.
By mapping these patterns against the earlier layers, you can spot contradictions (e.g., users claim they love a feature but never use it) and prioritize where to dig deeper.
4. Why Users Do It – The Motivational Root
The deepest layer uncovers the why behind actions. It requires building trust, conducting longitudinal interviews, and often combining ethnographic observation with quantitative data.
Effective approaches
- Jobs‑to‑Be‑Done interviews that focus on the circumstance, motivation, and desired outcome.
- Re‑interviewing the same participants after a product change to see if motivations shift.
- Mapping motivations to business goals to surface high‑impact opportunities.
Understanding why helps teams move from sympathy to empathy and, ultimately, to design solutions that align with users’ core goals.
From Insight to Action – Practical Practices for Teams
- Exposure Hours – Allocate two hours per quarter for every team member to observe real users (e.g., sit in on a support call or watch a usability session).
- Live UX Testing – Invite the whole product team to watch a moderated test in real time; discussion after the session cements shared understanding.
- Co‑Design Workshops – Let users rank or sketch feature ideas; this surfaces both stated preferences and hidden pain points.
- Help‑Desk Mining – Collect the top‑5 recurring complaints every six months and feed them into the backlog as research tickets.
- Listening In – Occasionally join a live chat or phone support queue to hear the language users use when they’re stuck.
These low‑cost tactics create a culture where user struggles are visible across the organization, not siloed in a UX team.
Balancing Emotion and Action
Emotion is a valuable signal, but it’s not the whole story. As Alin Buda points out, design is about solving problems, not merely feeling them. Use emotion as an early warning system—high frustration or delight often correlates with usability issues or opportunities—but follow up with concrete behavioural data before committing to a solution.
Wrapping Up
The four‑level framework reminds us that triangulation is essential. By collecting data at each level, reconciling contradictions, and focusing on why users act, designers can move beyond hunches to evidence‑based decisions. The result is a product that not only meets functional requirements but also aligns with the deeper motivations of its audience.
“Observe, diagnose, and act – don’t just validate what you already believe.” – Adapted from Nikki Anderson
Further Reading & Resources
- Hannah Shamji’s original visual guide: Four Levels of Customer Understanding (see image above)
- David Travis on practical research tactics: 60 Ways To Understand User Needs
- Geoffrey Roberts’ Emotion Wheel toolkit (PNG) – great for interview debriefs
- Thomas D’hooge’s study on verbal probability terms – illustrates the unreliability of language alone
- Vitaly Friedman’s Measure UX & Design Impact video course for deeper measurement techniques
Comments
Please log in or register to join the discussion