
A detailed case study reveals how solar panels and Tesla Powerwalls transformed electricity costs for a high-consumption UK household, achieving an effective energy rate of £0.03/kWh despite Britain's challenging climate.

For homeowners considering renewable energy investments, concrete data often speaks louder than theoretical projections. One UK household's full-year analysis of their 4.2kW solar array and triple Tesla Powerwall setup reveals significant savings – £3,078 in 2025 alone – while navigating Britain's notoriously cloudy weather and expensive electricity market.
The Energy Ecosystem
- Solar Array: 14x Perlight panels (4.2kWp) managed by Enphase
- Storage: 3x Tesla Powerwall 2 batteries enabling load-shifting
- Tariff: Octopus Energy's Smart Charging tariff (£0.28/kWh peak, £0.07/kWh off-peak)
- Export Rate: £0.15/kWh (activated mid-year after tariff upgrade)
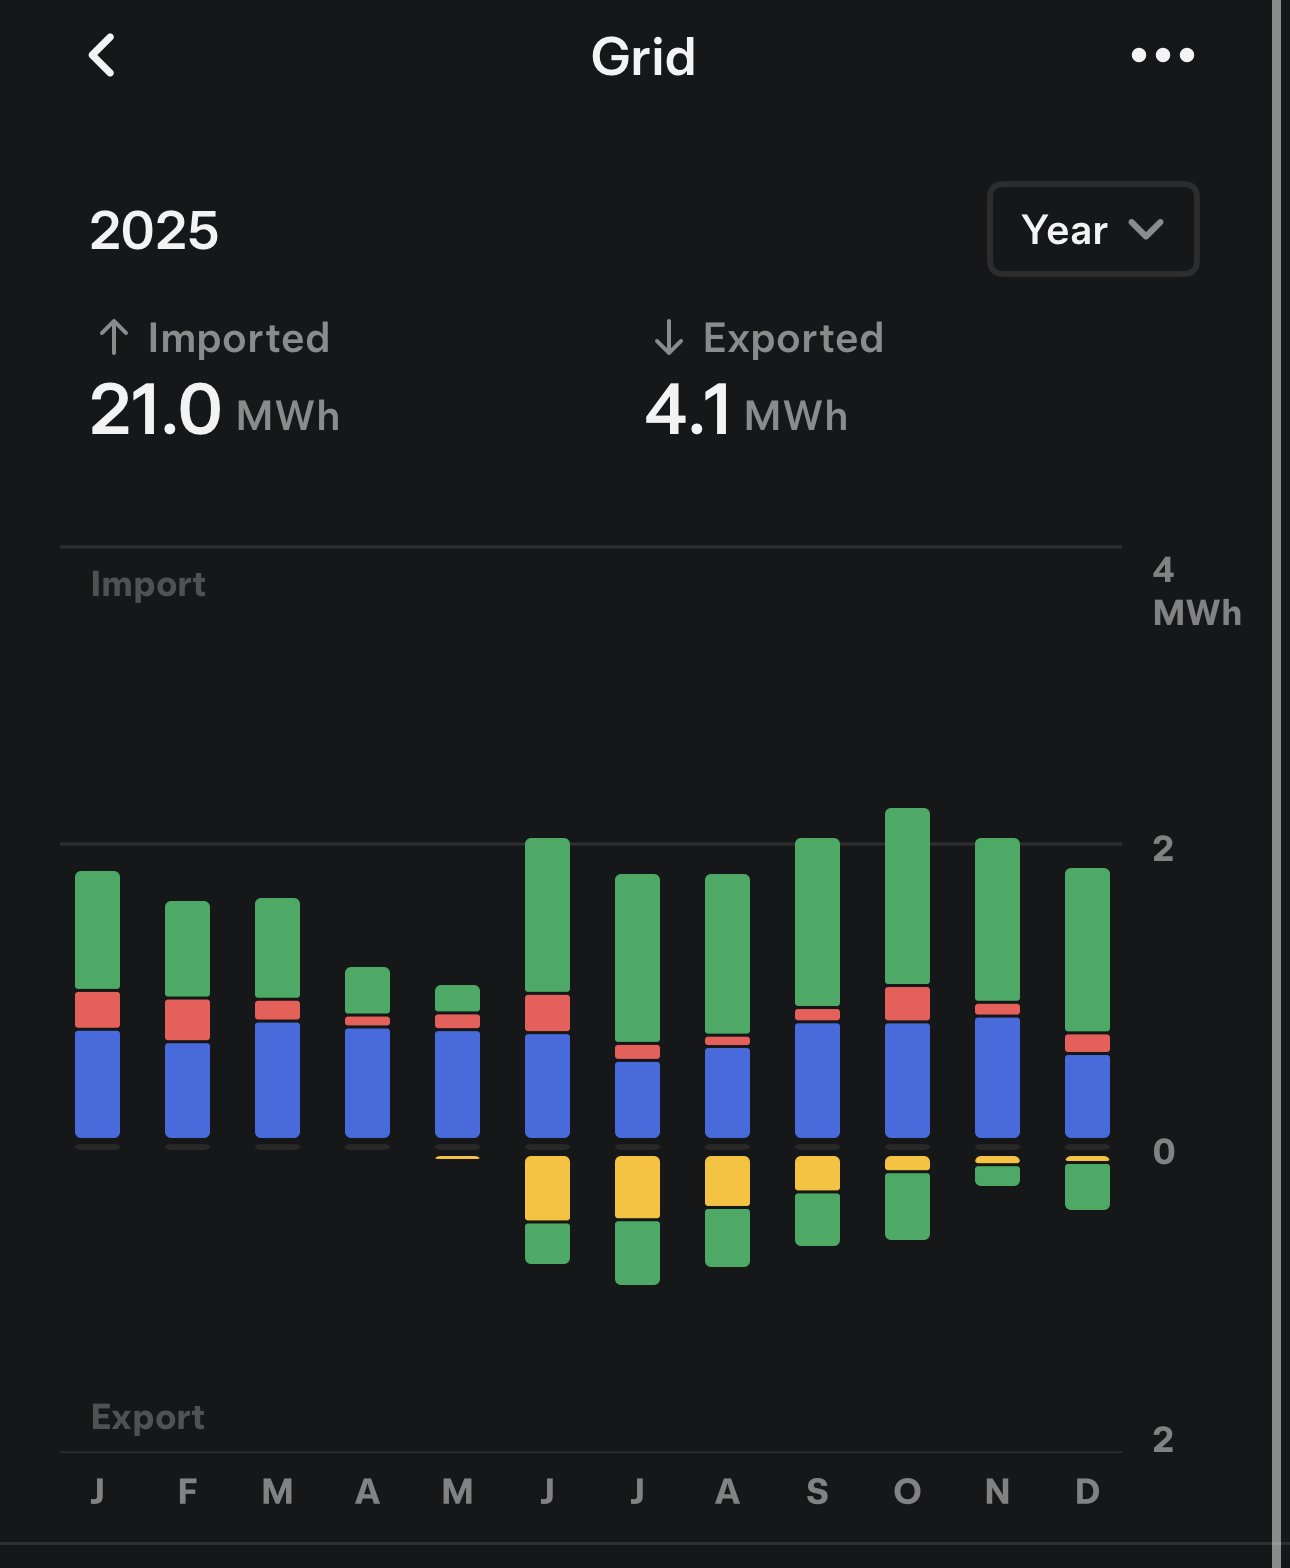
Grid Import: Three Data Sources Converge
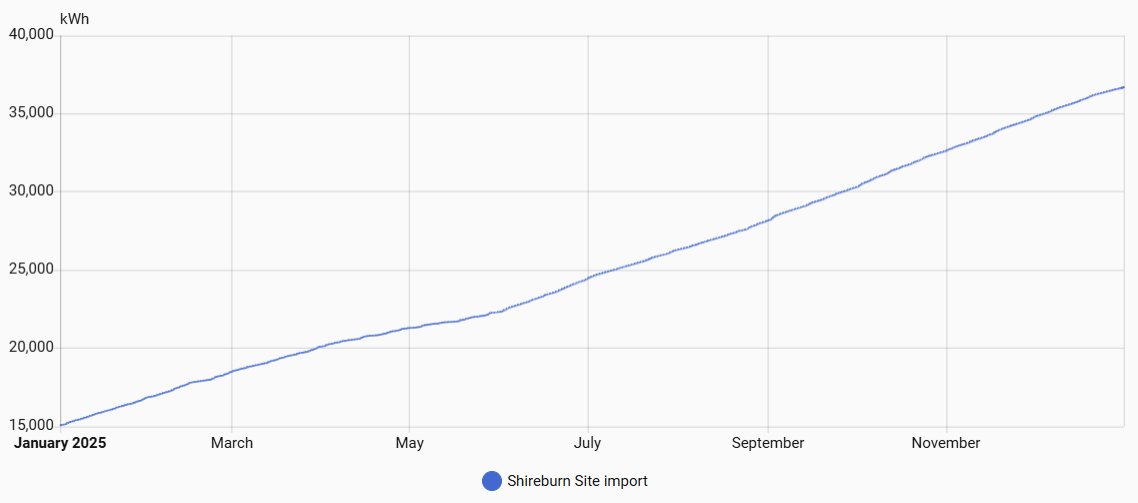 The household tracked consumption through multiple instruments, all aligning within 5% variance:
- Home Assistant CT Clamp: 21.6 MWh
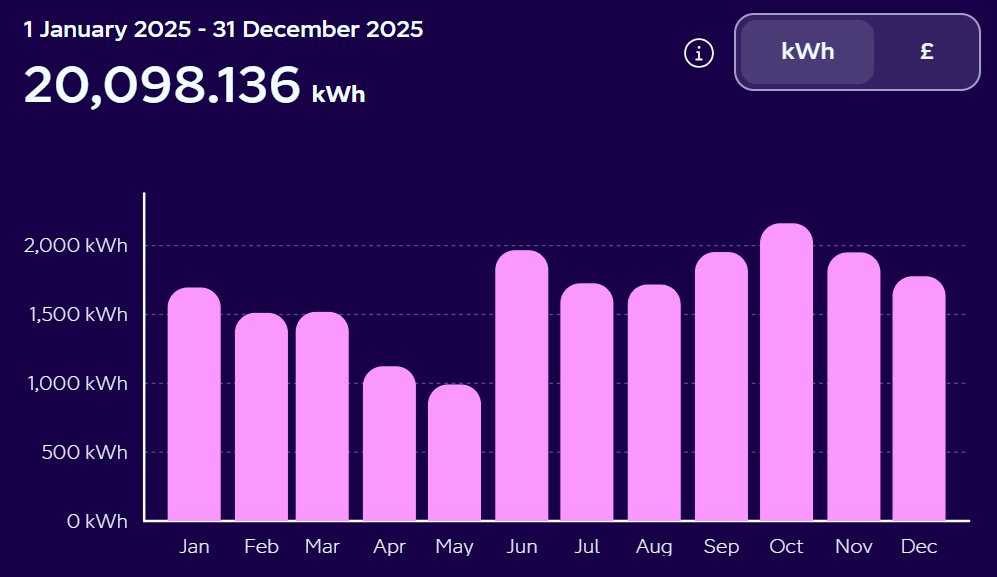
- Energy Supplier Billing: 20.1 MWh (used for calculations)
- Tesla Gateway: 21.0 MWh
The supplier's figure was prioritized since it determines actual costs. Monthly patterns showed predictable consumption dips during sunnier summer months.
Export & Solar Production
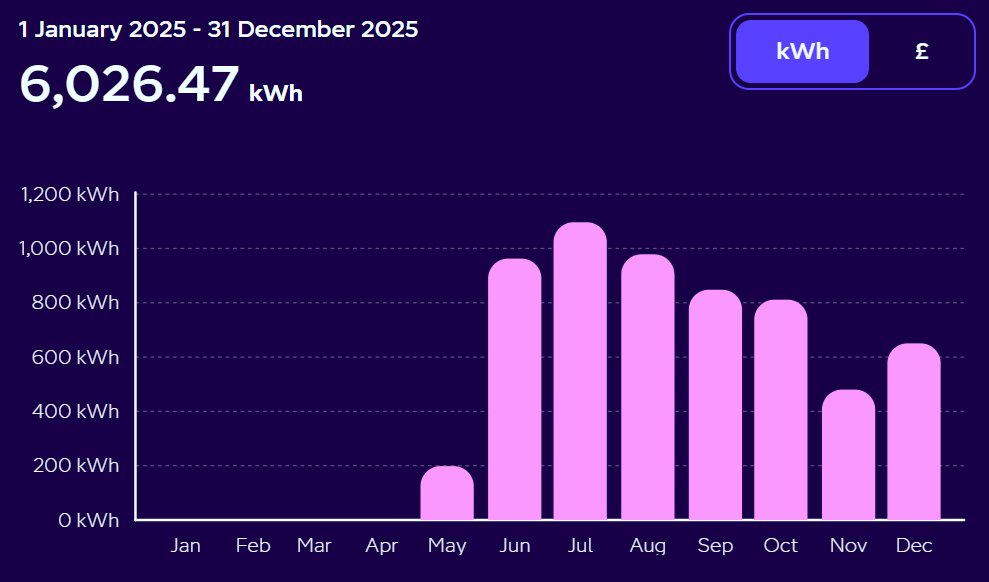 Export capabilities activated in June 2025, creating two distinct periods:
- Pre-June: Minimal export at £0.04/kWh
- Post-June: Active export at £0.15/kWh Total annual export reached 6.0 MWh despite only operating at full capacity for 60% of the year.
 Solar production faced Britain's climatic challenges but delivered 3.2 MWh annually. Peak output reached 2.841kW (67% of theoretical maximum) on July 8th. The Enphase monitoring system confirmed production figures.
Calculating True Savings
With 20.1 MWh imported, 3.2 MWh solar generated, and 6.0 MWh exported, net household consumption was 17.3 MWh. The financial impact becomes clear when comparing scenarios:
| Scenario | Annual Cost (No Solar/Battery) | Solar Only | Solar + Battery |
|---|---|---|---|
| Peak Rate | £4,844 | £3,948 | N/A |
| Off-Peak Rate | £1,211 | £987 | £557.37 |
Actual 2025 Outcome:
- Electricity Costs: £1,608.11 (including standing charges)
- Export Earnings: £886.49
- Net Cost: £557.37 (£0.03/kWh effective rate)
Return on Investment Analysis
The £39,360 installation cost breaks down as:
- £17,580 (Powerwalls #1 & #2)
- £13,940 (Solar Array)
- £7,840 (Powerwall #3)
Compared to estimated pre-installation costs of £3,632.86/year:
- Annual Savings: £3,078.49
- Payback Period: ~11 years
- Annual ROI: ~9%
Comments
Please log in or register to join the discussion