Multiple metrics reveal decades of stagnating or declining productivity in US construction, with sector-wide analyses showing alarming trends despite measurement complexities.

For over half a century, the American construction industry has presented economists with a confounding anomaly: while manufacturing productivity surged and technology transformed nearly every economic sector, construction productivity remained stubbornly stagnant or declined. This phenomenon isn't merely an academic curiosity—it directly impacts housing affordability, infrastructure development costs, and national economic growth. Stanford civil engineering professor Paul Teicholz first documented this troubling pattern in 2004, noting a 0.59% annual decline in construction productivity between 1964-2004, contrasting sharply with the 1.77% annual gains across other non-farm industries. Subsequent analyses by institutions ranging from the Federal Reserve to Goldman Sachs have consistently reinforced this troubling trajectory.
Sector-Wide Metrics: A Consistently Bleak Picture
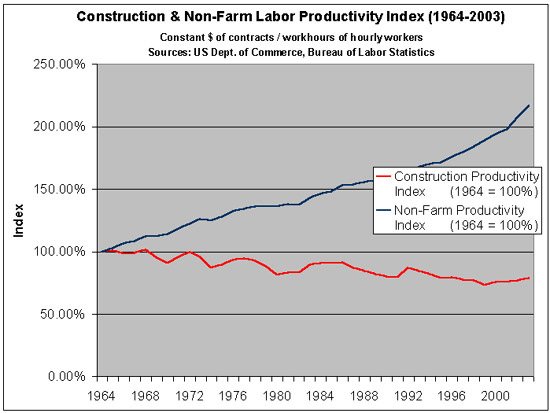
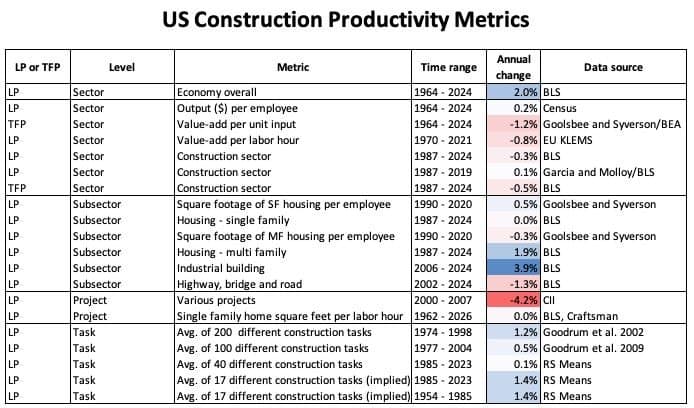
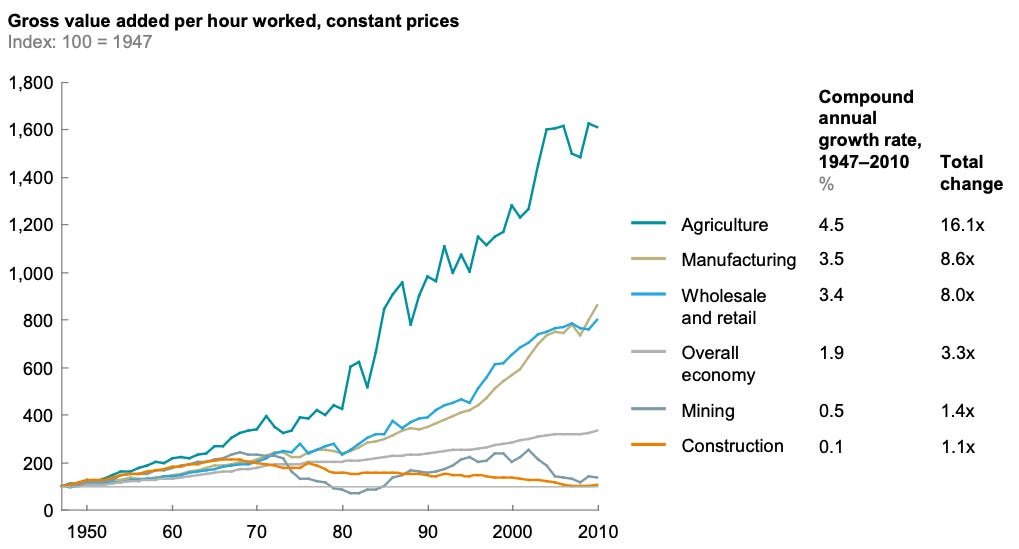
At the macroeconomic level, productivity metrics tracking the entire construction industry reveal alarming trends. When measuring total inflation-adjusted construction spending against total labor hours, productivity appears virtually flat between 1964 and 2024—a period during which overall US labor productivity tripled. The Bureau of Economic Analysis's value-add data paints an even bleaker picture: economists Austan Goolsbee and Chad Syverson's 2025 analysis shows construction productivity declining by roughly 50% since the mid-1960s. These sector-wide metrics matter because they indicate whether society receives more built environment per dollar invested over time—a crucial determinant of infrastructure affordability and economic efficiency.
Sub-Sector Variations and Housing Paradoxes
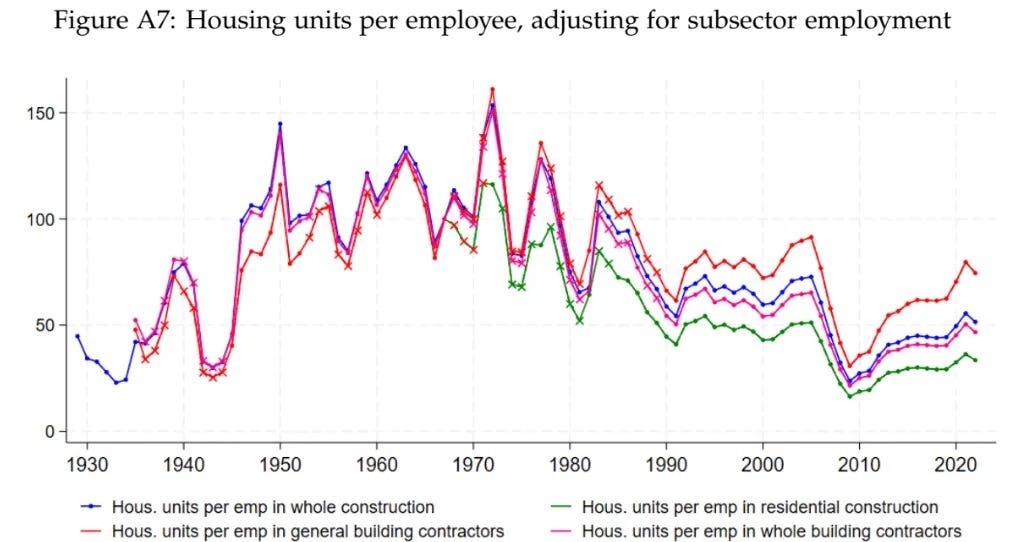
Drilling deeper into specific construction categories reveals nuanced variations beneath the bleak sector-wide data. Housing construction presents particularly contradictory signals: while metrics tracking housing units per employee show significant declines since the 1960s, square footage per employee tells a different story. Single-family home construction shows approximately 50% productivity gains between 1990-2020 by this measure, while multifamily construction shows declines. Bureau of Labor Statistics data further complicates the picture—industrial building construction shows productivity gains, highway construction shows declines, and single-family productivity remains stagnant since 1987. These discrepancies highlight how output definition dramatically influences productivity measurements—a problem Princeton economist Leonardo D'Amico and colleagues grappled with in their 2023 analysis of housing productivity.
Task-Level Productivity: Mixed Signals
The most granular productivity metrics—tracking specific construction tasks like framing, plumbing, or electrical work—reveal inconsistent patterns across different studies. Analyses of estimating guide data from firms like RS Means and Craftsman show bewildering variations: Goodrum's 2002 study found productivity improvements in 107 tasks versus declines in 30, while Craftsman's full-house estimates show only insulation installation demonstrating meaningful productivity gains since 1993. When comparing installation rates across decades, about one-third of tasks show improvement, one-third decline, and one-third stagnation. This inconsistency suggests localized efficiency gains haven't translated into systemic productivity improvements at project or sector levels—a disconnect requiring deeper investigation.
International Context and Measurement Complexities
The US productivity challenge isn't entirely unique among wealthy nations, though it appears particularly acute. KLEMS international productivity databases show that while Western European nations experienced construction productivity gains until the mid-1990s, most plateaued thereafter. Goldman Sachs' 2026 international comparison ranked the US last among wealthy nations for construction productivity growth since 1990. However, measurement complexities cloud all international comparisons. Construction productivity metrics face unique challenges: shifting output mixes (building more complex structures over time), inadequate quality adjustments (modern buildings have stricter safety/environmental standards), deflator selection issues (input vs. output price adjustments), and labor accounting problems (including renovation work in new construction metrics). As Teicholz demonstrated in 2013, applying seven different deflators to the same data could produce dramatically different productivity narratives.
Implications for Industry and Policy
The consistency of stagnant productivity findings across multiple methodologies suggests a fundamental industry challenge. While measurement complexities mean precise quantification remains elusive, the directional consensus—minimal productivity gains over decades—demands serious attention. Construction consumes nearly 4% of US GDP, meaning productivity stagnation has cascading economic consequences: higher infrastructure costs, reduced housing supply, and constrained public budgets. The industry's resistance to productivity gains seen in manufacturing—where automation and standardization yielded exponential efficiency improvements—points to structural barriers like fragmented project delivery, regulatory complexity, and risk aversion. Resolving this productivity paradox requires acknowledging both measurement limitations and systemic inefficiencies—a crucial first step toward building a more efficient future.
Comments
Please log in or register to join the discussion