Discover how t-tests, ANOVA, correlation, and even non-parametric methods are unified under linear regression. This paradigm shift simplifies statistics by revealing that most common tests are just applications of y = β₀ + β₁x with clever transformations.
For decades, statistics education has treated t-tests, ANOVA, correlation, and non-parametric methods as distinct tools—each with separate assumptions and formulas. But what if these tests shared a common DNA? In a groundbreaking synthesis, data scientist Jonas Kristoffer Lindeløv demonstrates that most common statistical tests are special cases of linear models (y = β₀ + β₁x) or their rank-transformed cousins. This revelation collapses artificial boundaries in statistics education and empowers practitioners with a unified framework.
The Core Insight: Everything Is Regression
At the heart of this equivalence is a simple truth:
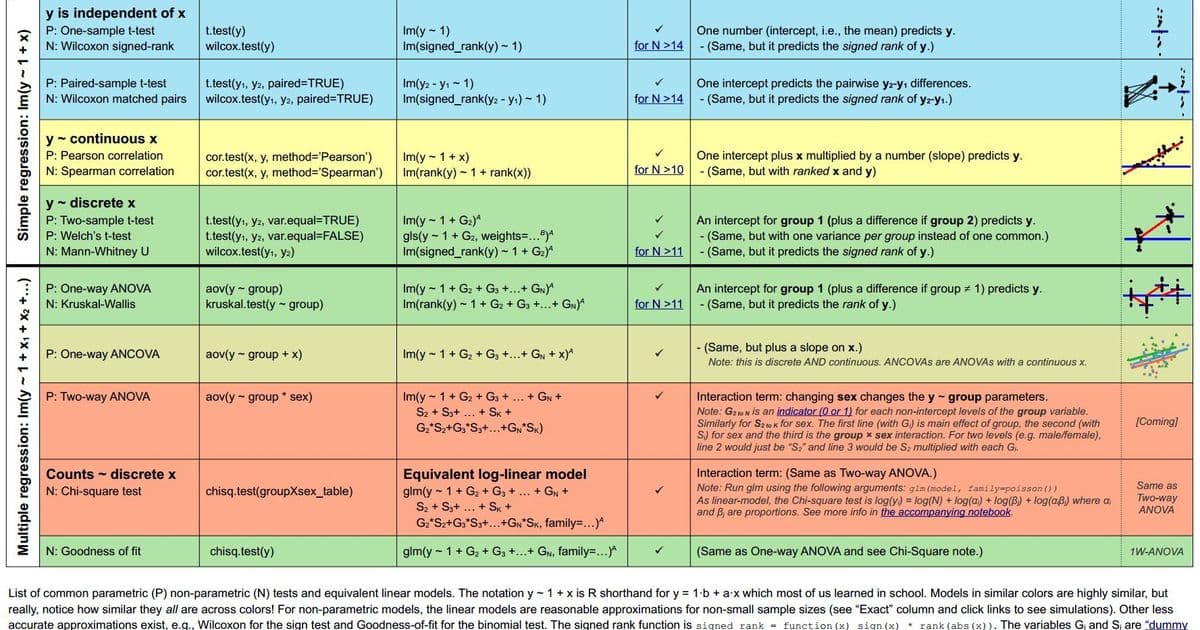
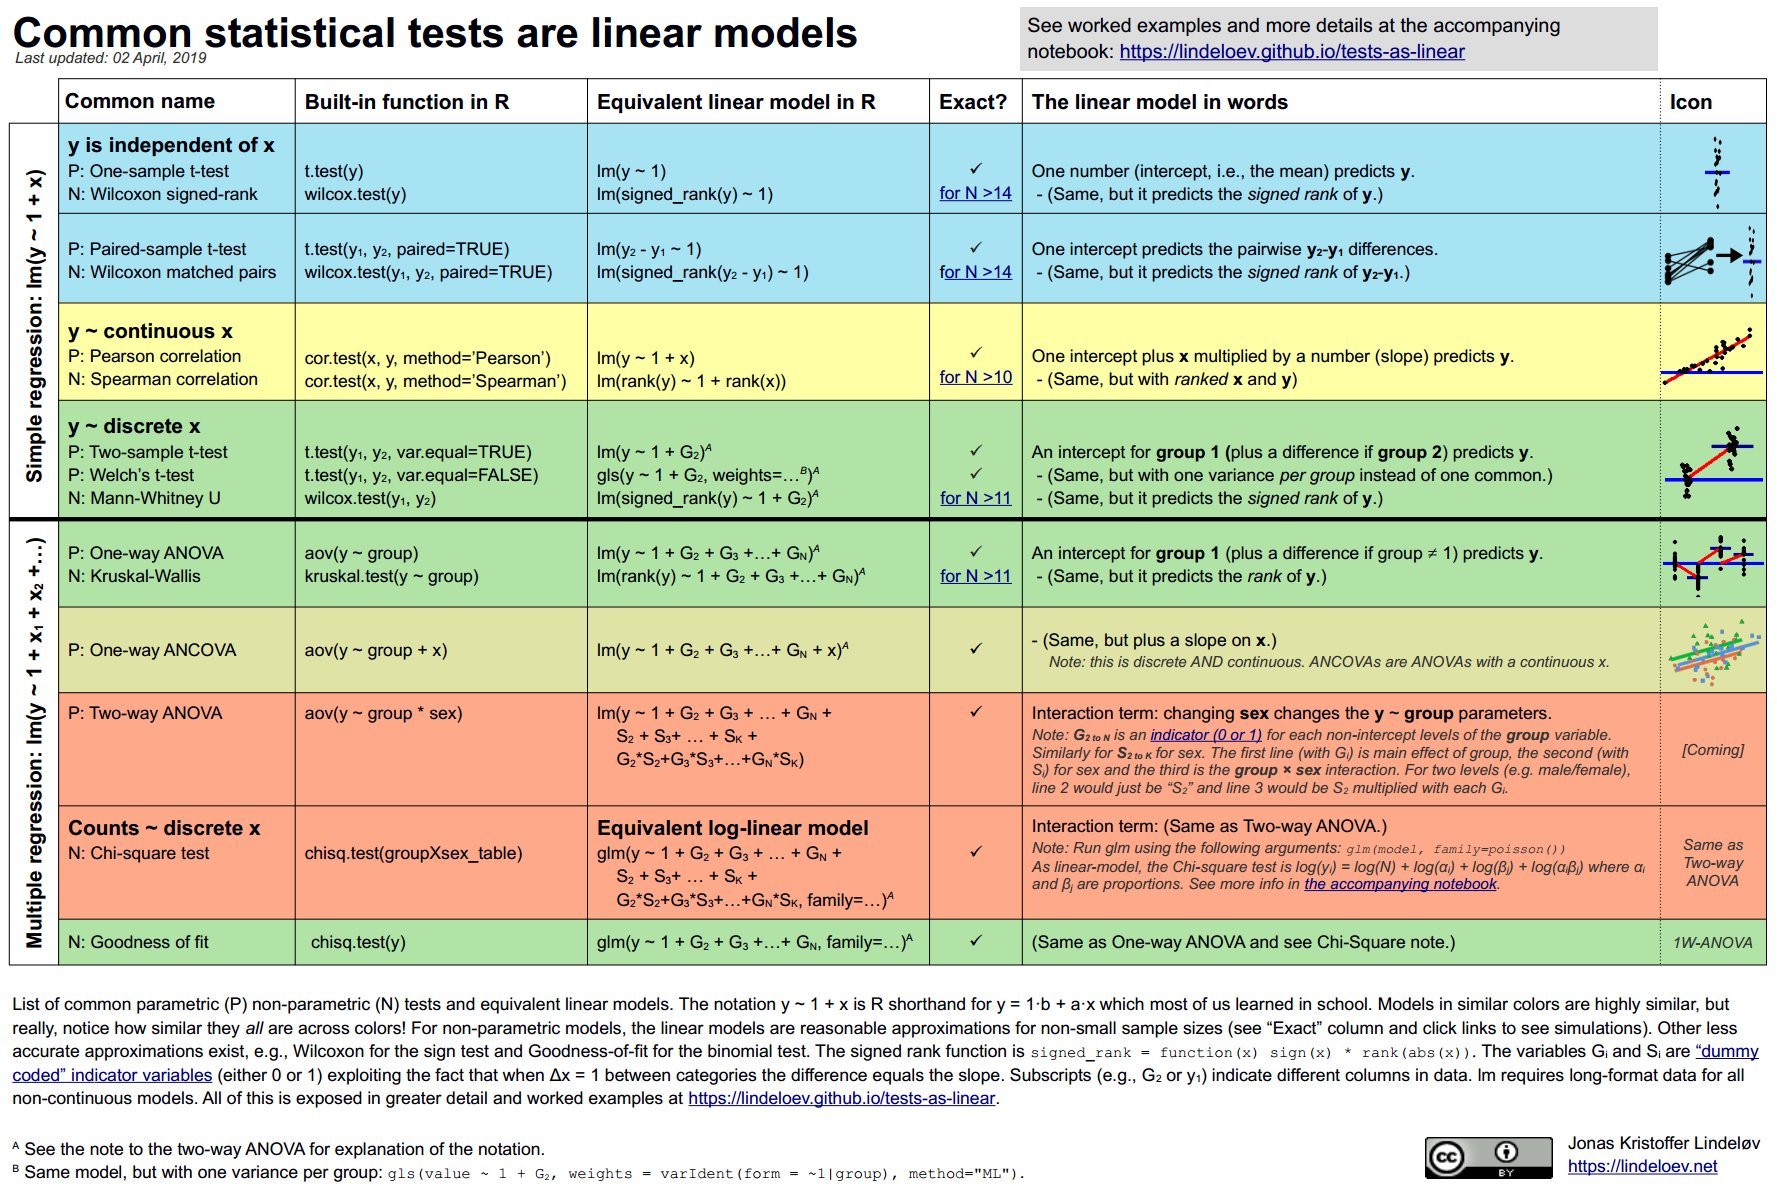
"Most common statistical models (t-test, correlation, ANOVA; chi-square, etc.) are special cases of linear models or a very close approximation. This beautiful simplicity means that there is less to learn."
Consider these equivalences:
T-tests become intercept models:
- One-sample t-test: y = β₀ (test if β₀ = 0)
- Independent t-test: y = β₀ + β₁*Group (test if β₁ = 0)
Pearson/Spearman correlation:
- Pearson: y = β₀ + β₁x
- Spearman: rank(y) = β₀ + β₁*rank(x)
ANOVA as multi-group regression:
- One-way ANOVA: y = β₀ + β₁Group₁ + β₂Group₂ + ...
Non-parametric tests as rank transformations:
- Wilcoxon signed-rank: signed_rank(y) = β₀
- Mann-Whitney U: rank(y) = β₀ + β₁*Group
# R code showing t-test vs. lm equivalence
t.test(y)
lm(y ~ 1)  # Same p-value & t-statistic
Why This Matters for Practitioners
- Reduced Cognitive Load: Instead of memorizing dozens of test assumptions, focus on linear model assumptions (independence, normality of residuals, homoscedasticity).
- Model Transparency: Coefficients (β) provide intuitive effect sizes—e.g., β₁ in an independent t-test is the mean difference between groups.
- Non-parametric Demystified: "Non-parametric" tests like Mann-Whitney U are simply linear models on rank-transformed data (accurate for N > 15).
The Teaching Revolution
Lindeløv argues that intro stats courses should start with linear models:
"Teaching linear models first and then name-dropping the special cases along the way makes for an excellent strategy, emphasizing understanding over rote learning."
This approach naturally extends to Bayesian and permutation-based inferences, avoiding early entanglement with p-values or type-I errors.
Beyond Basics: Chi-Square and ANCOVA
The framework scales elegantly:
- Chi-Square tests: Log-linear models (e.g., log(y) = β₀ + β₁*Group) handle contingency tables.
- ANCOVA: Simply add continuous covariates (e.g., y = β₀ + β₁Group + β₂age).
A Call for Change
The implications are profound: by embracing linear models as the "Swiss Army knife" of statistics, we can:
- Unify parametric and non-parametric paradigms
- Simplify software implementation (just
lm()and rank transformations) - Focus on effect sizes and confidence intervals over ritualistic hypothesis testing
As Lindeløv concludes, this isn't just mathematical trivia—it's a lens that makes statistics more coherent, interpretable, and powerful. For developers and data scientists, it’s time to wield this unified toolset.
Source: Jonas Kristoffer Lindeløv's blog
Comments
Please log in or register to join the discussion