
Superluminal’s sampling profiler was bottlenecked by libdwarf’s quadratic unwinding logic, taking over a second to extract 1.5 million unwind rows. A series of targeted optimizations—from linear iteration to disabling harmless‑error reporting and allocation tracking—cut extraction time to 83 ms, an 8.6× speed‑up and 89 ns per row.
Unwinding the Unwind: A 9‑fold Boost in libdwarf’s .eh_frame Enumeration
Superluminal is a sampling profiler that periodically captures stack traces to answer where a program spends its time and how it got there. At the heart of this stack‑trace capture lies the .eh_frame section of a binary, a DWARF‑encoded table originally designed for C++ exception handling. The unwinding logic must, given a register state, compute the state of the caller’s registers and the return address.
The goal of this information is to answer the question: given the current register state, what would the register state become if the current function were to immediately return and resume execution in its caller? – R. R.
In practice, libdwarf parses this bytecode‑encoded unwind table to rebuild a sparse register table for each program counter. The process is fast enough for a debugger that looks up a single address, but when Superluminal needs to enumerate every row for a binary, the original implementation turns into a quadratic nightmare.
Baseline Performance
The test binary was a UE5 engine module with 1 548 145 rows and 3 373 919 bytecode instructions spread across 154 361 functions. Using libdwarf’s dwarf_get_fde_info_for_all_regs3_b in a tight loop, the extraction phase alone took 1 007 ms—over 774 nanoseconds per row—and the total run time was 1 198 ms.
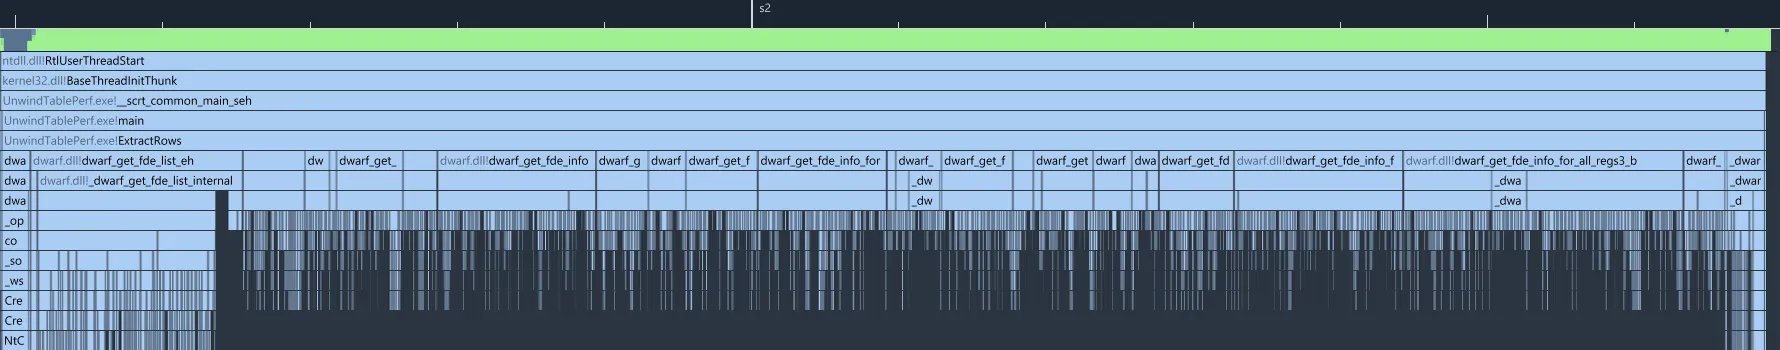
The profiler timeline showed three distinct phases:
| Phase | Time | Description |
|---|---|---|
| Setup | 164 ms | Building the FDE list (dwarf_get_fde_list_eh). |
| Extraction | 1 007 ms | Iterating over every row with dwarf_get_fde_info_for_all_regs3_b. |
| Shutdown | 27 ms | Cleaning up libdwarf data structures. |
The extraction phase dominated the total cost.
The Quadratic Bottleneck
A deeper look at the call graph revealed that dwarf_get_fde_info_for_all_regs3_b internally calls _dwarf_exec_frame_instr for every row. That helper re‑interprets the entire bytecode stream from the start of the function until it passes the requested address—a linear scan that is repeated for every row.
Simplified, the algorithm looks like:
for each function:
    for each row:
        for each instruction:
            execute instruction
            if current_location > requested_pc:
                break
With an average of 22 bytecode instructions per function and 10 rows per function, each function required roughly 220 instruction executions instead of the linear 22. Across 154 361 functions, this inflated the instruction count from 3.4 M to ~34 M—a 10× overhead.
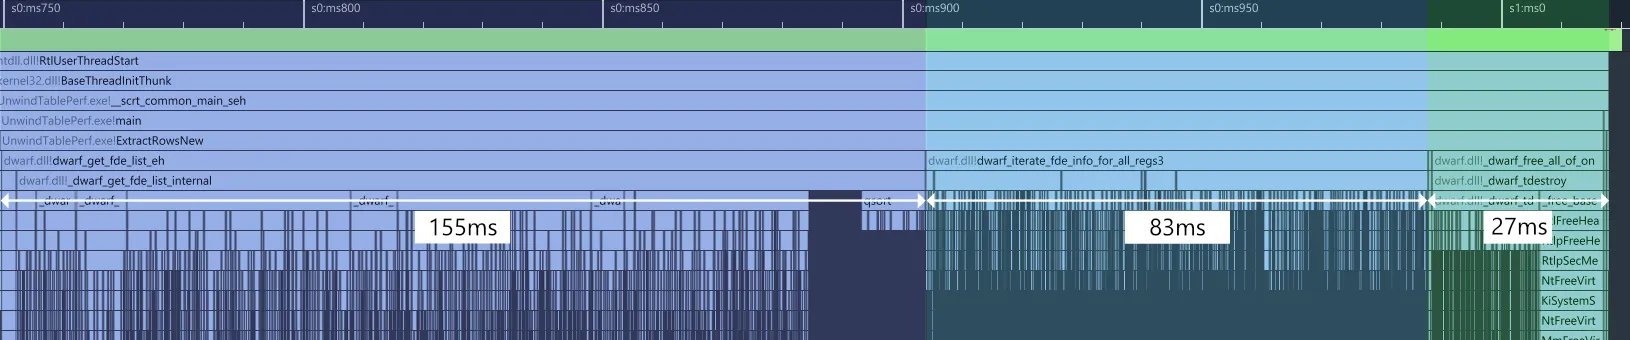
Linear Iteration: The First Breakthrough
Replacing the per‑row lookup with a single pass over the frame description entry solved the quadratic problem. The new API, dwarf_iterate_fde_info_for_all_regs3, walks the bytecode once, invoking a callback on each DW_CFA_advance_loc. The extraction time dropped from 1 007 ms to 83 ms, a 12× speed‑up.
The call graph shrank dramatically, and helper functions like _dwarf_uint64_mult vanished from the profile.
Disabling Harmless Errors
The next culprit was validate_length, called during FDE creation. It spent 66 ms building error strings for harmless errors that are only relevant in unit tests. By adding dwarf_set_harmless_errors_enabled(0), the entire error‑reporting path was bypassed, shaving another 98 ms from the setup phase.
Skipping Allocation Tracking
Libdwarf tracks every internal allocation in a red‑black tree (_dwarf_tsearch) so that all memory can be freed on dwarf_finish. In Superluminal’s use case, memory is freed manually, making this tracking unnecessary. Disabling it via dwarf_set_de_alloc_flag(0) eliminated a 41 ms overhead in allocation and a 27 ms shutdown cost, reducing the shutdown phase to 0.5 ms.
Final Numbers
| Phase | Baseline | Optimized |
|---|---|---|
| Setup | 164 ms | 155 ms |
| Extraction | 1 007 ms | 83 ms |
| Shutdown | 27 ms | 0.5 ms |
| Total | 1 198 ms | 208 ms |
8.6× speed‑up – from 1 198 ms to 208 ms, or 89 nanoseconds per row.
The optimizations bring Superluminal’s .eh_frame enumeration to the same order of magnitude as a well‑tuned debugger, enabling the profiler to process over 11 million rows per second.
Takeaway
A careful, data‑driven analysis of a legacy library can uncover hidden quadratic behaviors and unnecessary safety checks. By restructuring the iteration logic, disabling test‑only error reporting, and turning off unused allocation tracking, a production tool can be made almost ten times faster without breaking existing clients. The lessons apply broadly: when performance matters, start by profiling the real workload, then target the algorithmic roots rather than surface‑level micro‑optimizations.
Comments
Please log in or register to join the discussion