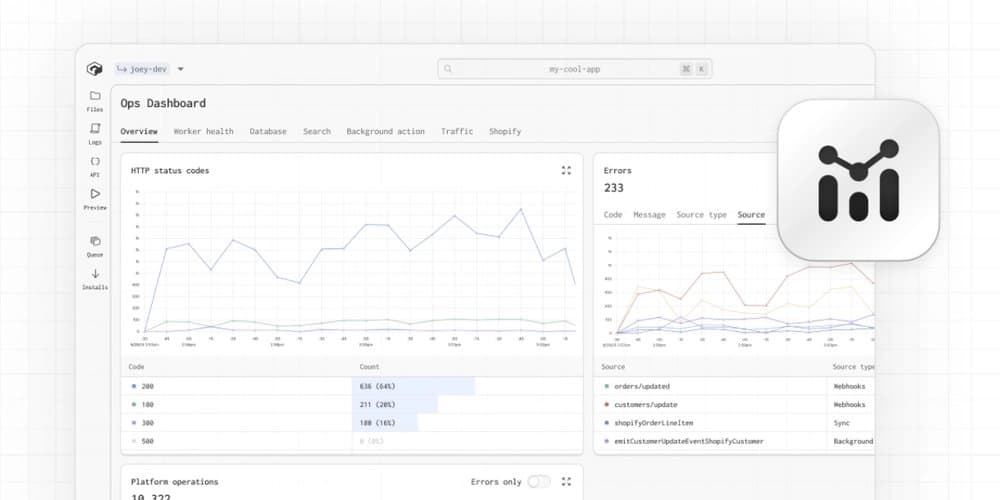
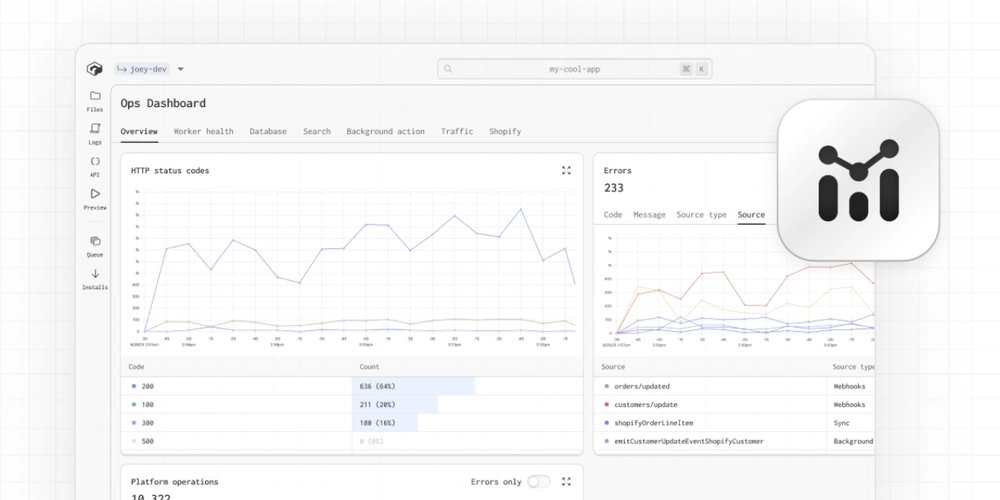
Gadget's new operations dashboard provides unified visibility into application performance across all environments, enabling developers to diagnose issues before they reach production.
Modern application development faces a critical visibility gap: developers often build in isolated environments divorced from production realities, while operations teams struggle to diagnose issues without context about how the system behaves under real conditions. Gadget's new operations dashboard tackles this disconnect by providing a unified view of application behavior across development, staging, and production environments.
The Production-Development Divide
Traditional monitoring solutions create operational blind spots:
- Environment inconsistency: Local development environments lack production-scale infrastructure
- Telemetry fragmentation: Metrics, logs, and traces reside in siloed systems
- Delayed feedback: Performance issues surface only after production deployment
- Context loss: Resource usage metrics lack connection to application logic
Gadget bridges this gap by running every development environment on actual cloud infrastructure with production-equivalent scaling characteristics. The operations dashboard surfaces operational signals from the earliest coding stages through production deployment.
Unified Observability Planes
The dashboard integrates seven critical observability planes on a shared timeline:
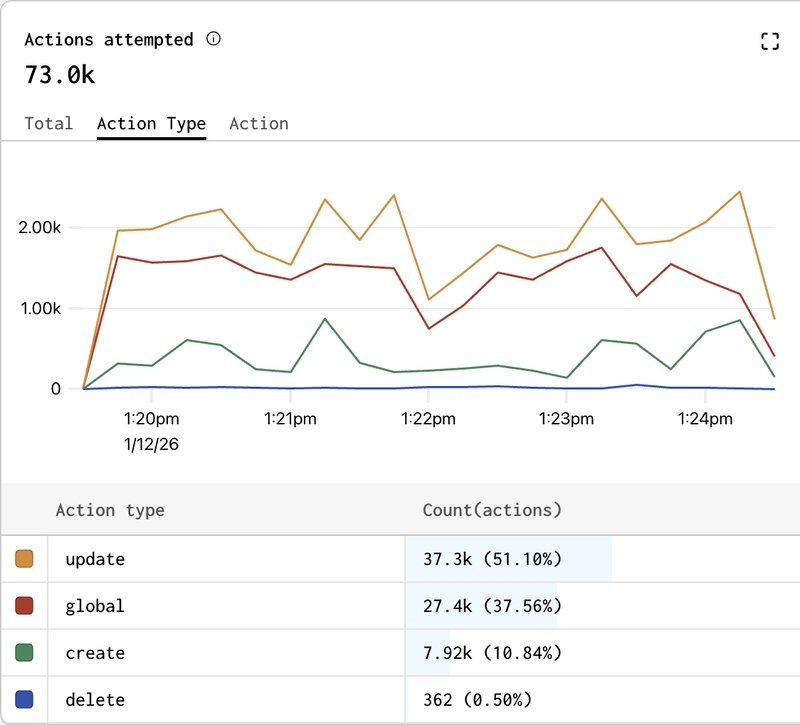
- App Overview: HTTP status distributions, error rates, action execution counts
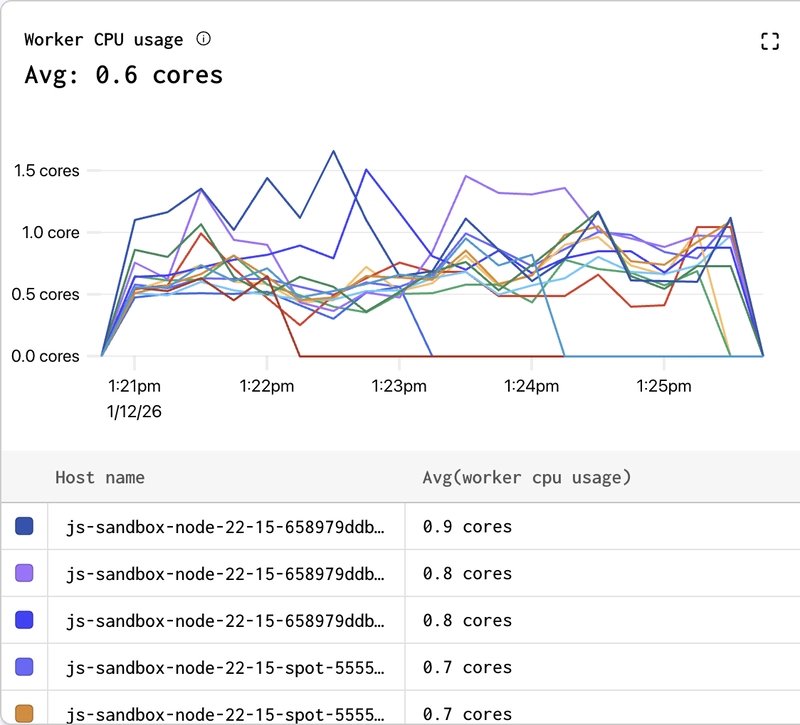
- Worker Health: CPU/memory utilization with event loop metrics (Documentation)
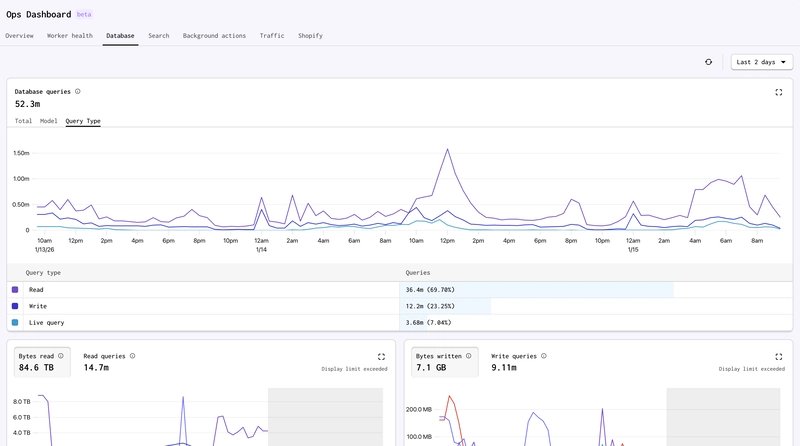
- Database Operations: Query volume, index efficiency, storage growth
- Search Performance: Indexing throughput and query latency
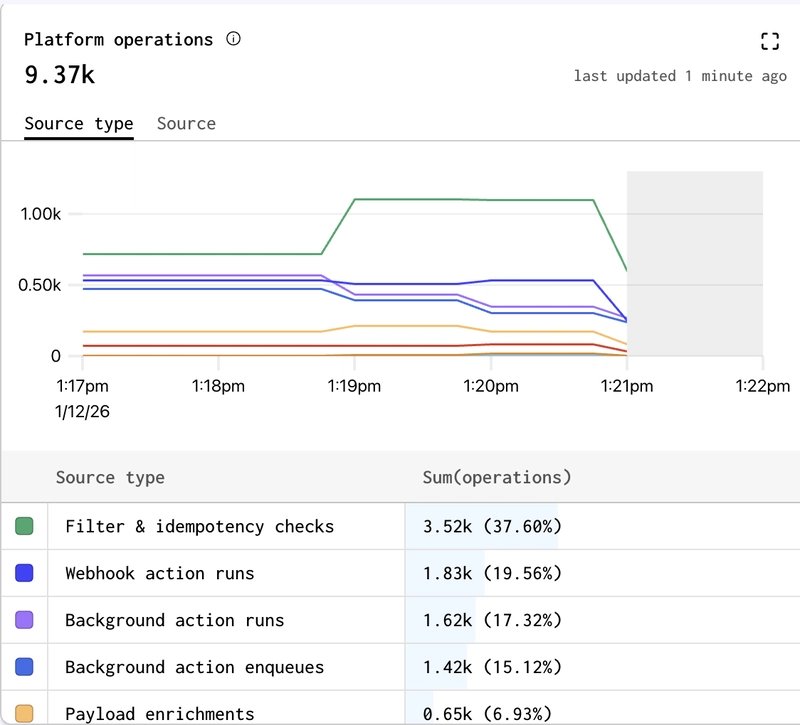
- Background Processing: Action queue depth, retry patterns, failure rates
- Traffic Analysis: Request volume, bandwidth consumption, page load times
- Shopify Integration (for commerce apps): API call rates, webhook processing
The shared timeline enables causal analysis across layers. A spike in database read operations can be immediately correlated with background job queue growth or increased Shopify API calls during the same timeframe.
Diagnostic Workflows in Practice
Engineers leverage the dashboard for concrete troubleshooting scenarios:
Performance Regression Analysis After deployment, increasing API latency appears. Instead of guessing, developers:
- Correlate latency increase timeline with CPU utilization
- Check database metrics for query volume changes
- Verify whether background processing queues are backing up
- Identify whether new inefficient queries are causing table scans
Resource Cost Attribution When monthly cloud costs increase unexpectedly:
- Pinpoint date ranges of cost increases
- Cross-reference with feature deployments
- Identify whether cost drivers are essential (user growth) or inefficient (N+1 queries)
- Make optimization decisions based on cost/benefit analysis
Development Phase Prevention During feature development:
- Monitor database write volume while testing new sync logic
- Detect search indexing bottlenecks before production deployment
- Identify background job retry patterns during integration testing
Architectural Foundations
The dashboard's effectiveness stems from architectural choices:
- Uniform Runtime: Identical execution environments from development to production eliminate configuration drift
- Precomputed Metrics: ClickHouse-backed materialized views enable real-time exploration of high-cardinality data without query latency
- Cost-Resource Mapping: Direct correlation between application patterns (Shopify syncs, search indexing) and infrastructure costs
- Time-Series Alignment: Nanosecond-precision event timestamps enable cross-component correlation
Tradeoffs and Constraints
While powerful, the approach involves deliberate tradeoffs:
- Vendor Lock-in: Tight integration with Gadget's platform limits portability
- Abstraction Costs: Developers sacrifice low-level infrastructure control for operational visibility
- Sampling Limits: High-volume event streams require careful aggregation strategies
- Customization Boundaries: Predefined metrics may not capture all application-specific signals
Operational Impact
The dashboard fundamentally shifts cost optimization workflows. Instead of reactive cloud bill analysis, developers:
- See real-time cost impact of inefficient queries during development
- Understand how Shopify sync patterns drive database storage growth
- Identify background job retries as hidden cost drivers
- Make informed decisions about indexing strategies based on actual query patterns
This transforms cost from a post-deployment surprise to an integral part of the development feedback loop.
Conclusion
Gadget's operations dashboard represents a paradigm shift in application observability by eliminating the artificial boundary between development and production monitoring. By providing consistent, correlated metrics across all environments, it enables engineers to:
- Detect inefficient patterns during development
- Diagnose production issues with full context
- Understand cost drivers before deployment
- Reduce debugging time through cross-signal correlation
For teams building on Gadget, the dashboard is available in all environments. Explore the complete documentation or join the discussion in the developer Discord.
Comments
Please log in or register to join the discussion