A new open-source tool transforms OpenStreetMap data into stunning electrical grid posters, offering unprecedented visualization of power infrastructure across continents and countries.
Grid2Poster: Visualizing Global Energy Infrastructure with Open Data
In an era where energy infrastructure is undergoing rapid transformation, a new open-source project is providing a unique lens through to view the complex networks that power our societies. Grid2Poster transforms raw OpenStreetMap data into visually striking posters that reveal the intricate web of electrical grids spanning entire continents or individual countries.
What is Grid2Poster?
Grid2Poster is a Python-based tool that downloads and renders transmission line infrastructure from OpenStreetMap data to create print-ready posters. The project, inspired by the earlier maptoposter, leverages several powerful geospatial libraries including GeoPandas, OSMnx, and Matplotlib to process and visualize electrical grid data.
"The ability to visualize entire electrical grids at continental scale represents a significant step in making energy infrastructure more accessible and understandable," says the project's documentation. "These visualizations can serve educational, planning, or advocacy purposes by revealing the scale and complexity of our energy systems."
Technical Implementation
At its core, Grid2Poster queries OpenStreetMap for features tagged as power=line, with optional inclusion of power=minor_line and power=cable features. The tool processes this data using several key steps:
- Boundary Definition: The tool accepts country names, region names, or custom GeoJSON boundaries to define the area of interest.
- Data Retrieval: Uses the Overpass API to download transmission line data, breaking large areas into tiles to manage API request limits.
- Data Processing: Employs GeoPandas for geospatial operations and OSMnx for network handling.
- Visualization: Renders the processed data using Matplotlib with various customizable themes.
- Output Generation: Produces print-ready files in PNG, SVG, and PDF formats.
The tool handles large-scale visualization efficiently, as evidenced by its ability to render entire continents like Africa, which requires hundreds of Overpass API queries and can take several hours to complete.
Visualizing Global Energy Networks
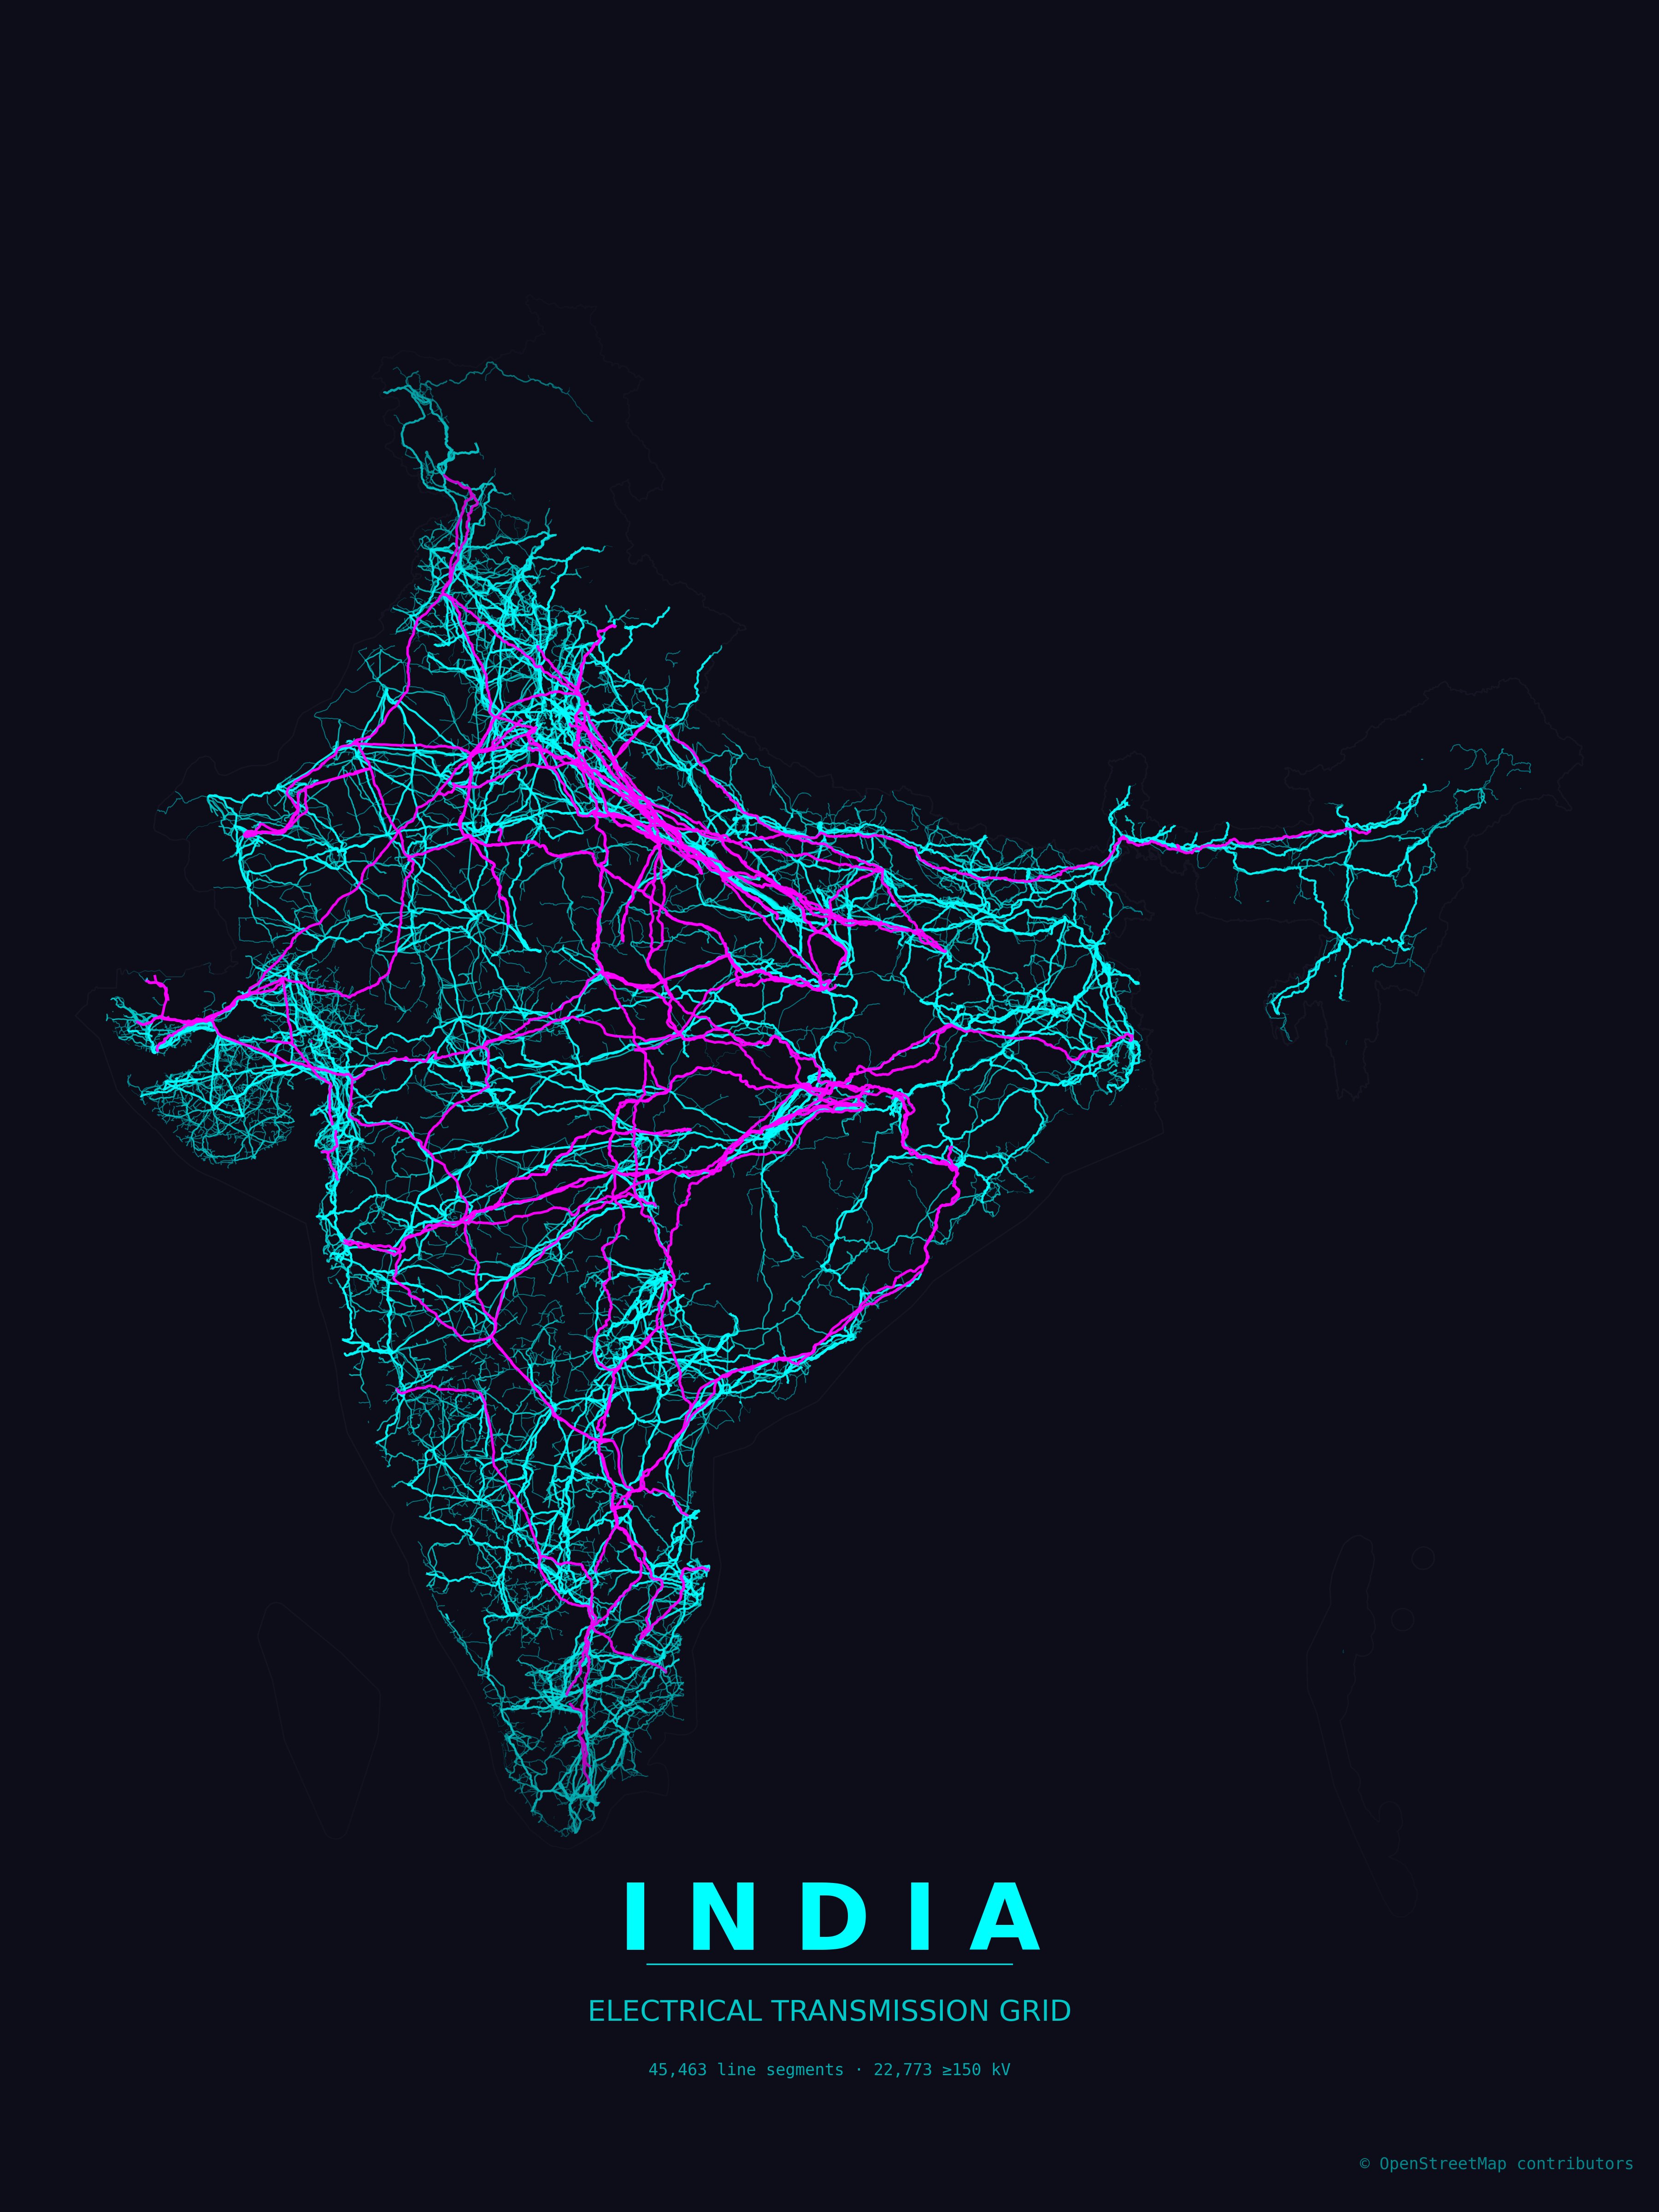
One of Grid2Poster's most compelling features is its ability to generate posters at various scales. From individual countries to entire continents, the tool provides a consistent visualization approach that enables comparison across different regions.
 Africa's transmission grid visualized using the paper_grid theme
The project includes several predefined regions representing common power-system groupings, such as:
- Continental Europe (31 countries)
- Latin America and the Caribbean
- Mediterranean region
- West African Power Pool members
These predefined regions are particularly valuable for analyzing cross-border energy infrastructure and regional integration efforts.
Customization and Theming
Grid2Poster offers extensive customization options through its various themes and parameters. Users can:
- Choose from multiple visual themes including
paper_grid,japanese_ink,neon_cyberpunk, and others - Select different paper sizes and orientations
- Control the level of detail by including minor lines and cables
- Adjust padding and zoom levels
- Customize title and subtitle text
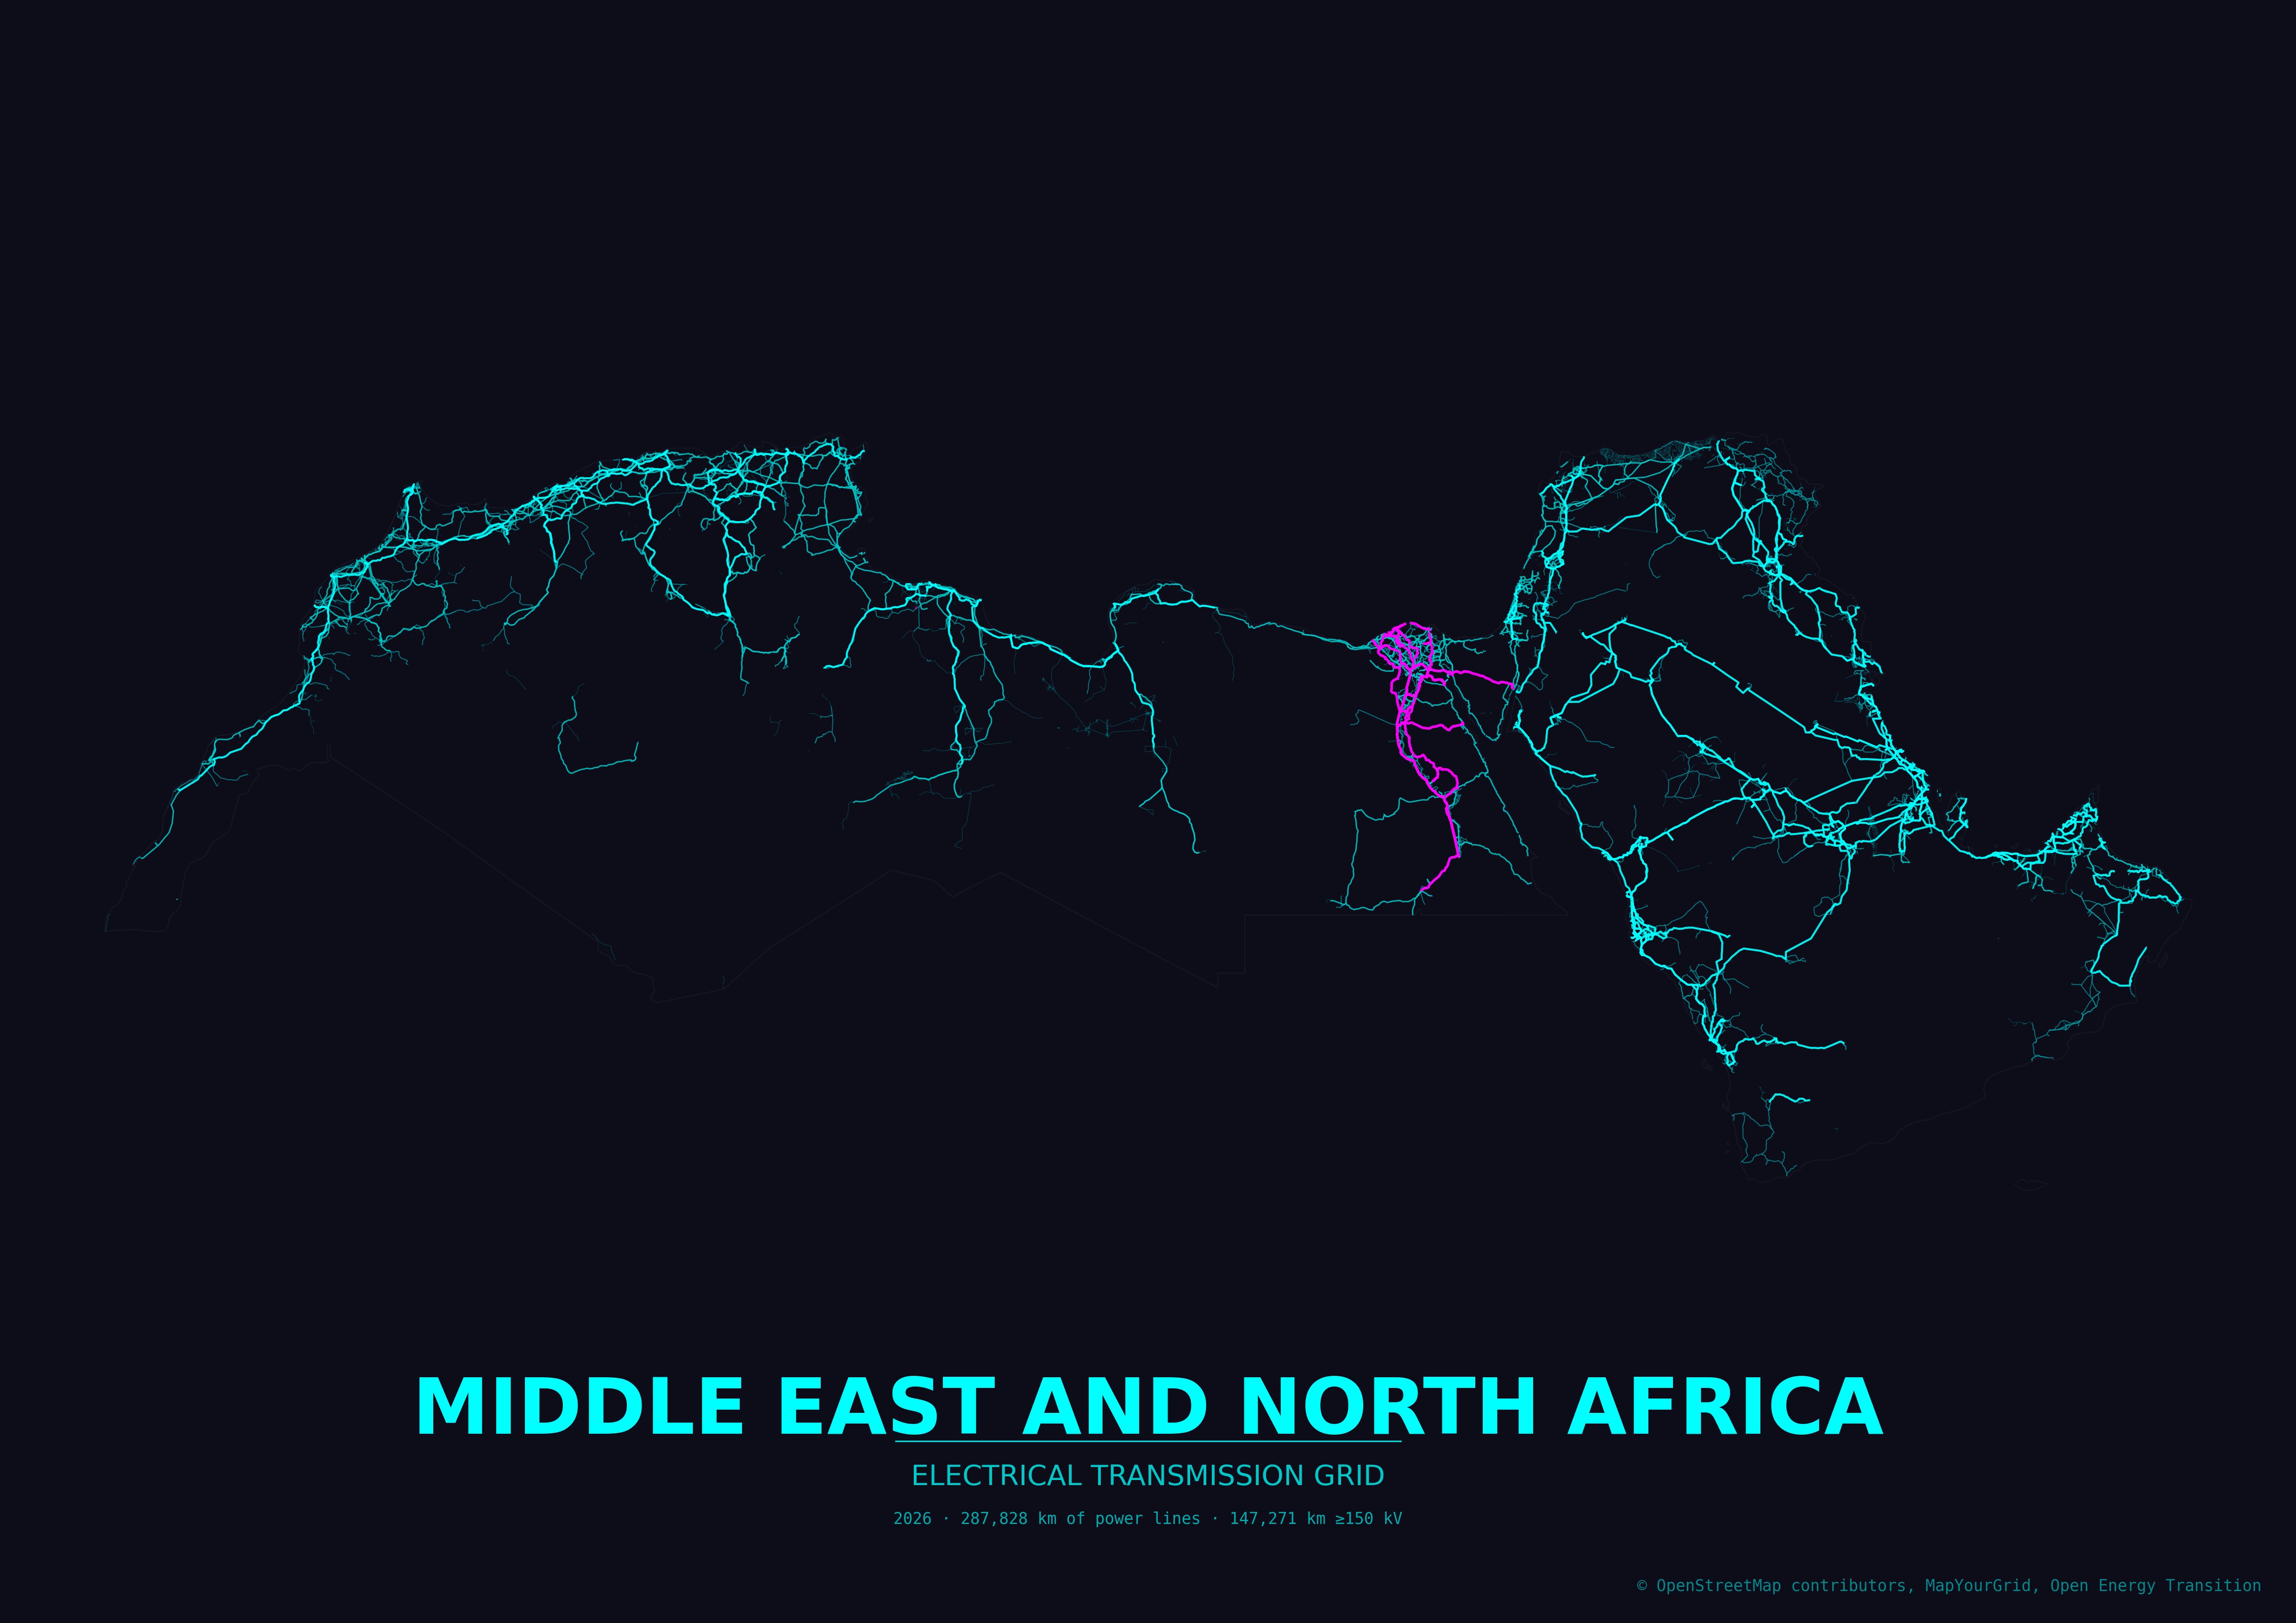 Middle East and North Africa grid in neon_cyberpunk theme
The theming system is particularly noteworthy, as it allows users to create custom visual styles by modifying JSON files in the themes directory. This flexibility enables the tool to serve diverse aesthetic preferences and use cases.
Why This Matters
Grid2Poster addresses several important needs in the energy sector:
- Democratizing Energy Data: By leveraging OpenStreetMap, the tool makes energy infrastructure data accessible without proprietary restrictions.
- Enhanced Understanding: Visualizations can reveal patterns in energy infrastructure that might be obscured in tabular data.
- Educational Value: The posters serve as excellent teaching tools for energy systems, geography, and urban planning.
- Planning and Advocacy: Community groups, planners, and activists can use these visualizations to advocate for better energy infrastructure.
- Research Applications: Researchers studying energy systems, climate resilience, or infrastructure development can benefit from these visualizations.
Community-Driven Data Improvement
The project acknowledges that the quality of visualizations depends on OpenStreetMap coverage in the selected region. To address this limitation, Grid2Poster connects with MapYourGrid, a community initiative that coordinates efforts to improve transmission infrastructure mapping in OpenStreetMap.
"Coverage and quality in your country can be improved by mapping transmission infrastructure directly in OpenStreetMap," the project documentation explains. "MapYourGrid provides tutorials, country-level completeness/quality statistics and mapping tools for tracing power lines, generators and substations from imagery."
This community-driven approach creates a positive feedback loop: better data leads to better visualizations, which in turn can inspire more people to contribute to improving the data.
Practical Applications
Grid2Poster has numerous practical applications across different sectors:
- Energy Planning: Utilities and planners can use these visualizations to identify infrastructure gaps and plan expansions.
- Educational Materials: Teachers can use the posters to illustrate energy systems in geography, environmental science, and engineering classes.
- Policy Advocacy: Community groups can leverage these visualizations to advocate for renewable energy integration or improved grid infrastructure.
- Research Analysis: Researchers studying energy networks, climate resilience, or infrastructure development can use these visualizations as foundation materials.
- Public Engagement: Museums, exhibitions, and public spaces can display these posters to engage the public with energy infrastructure topics.
Limitations and Opportunities
Despite its capabilities, Grid2Poster has some limitations:
- Data Dependency: The quality of visualizations depends on OpenStreetMap coverage, which varies significantly by region.
- Processing Time: Large continental-scale visualizations can take several hours to generate.
- Technical Expertise: Requires some familiarity with Python and command-line interfaces.
These limitations also present opportunities for future development:
- Improved data processing algorithms could reduce generation times
- A web interface could make the tool more accessible to non-technical users
- Integration with other energy data sources could enrich the visualizations
- Animated visualizations showing grid evolution over time could add another dimension
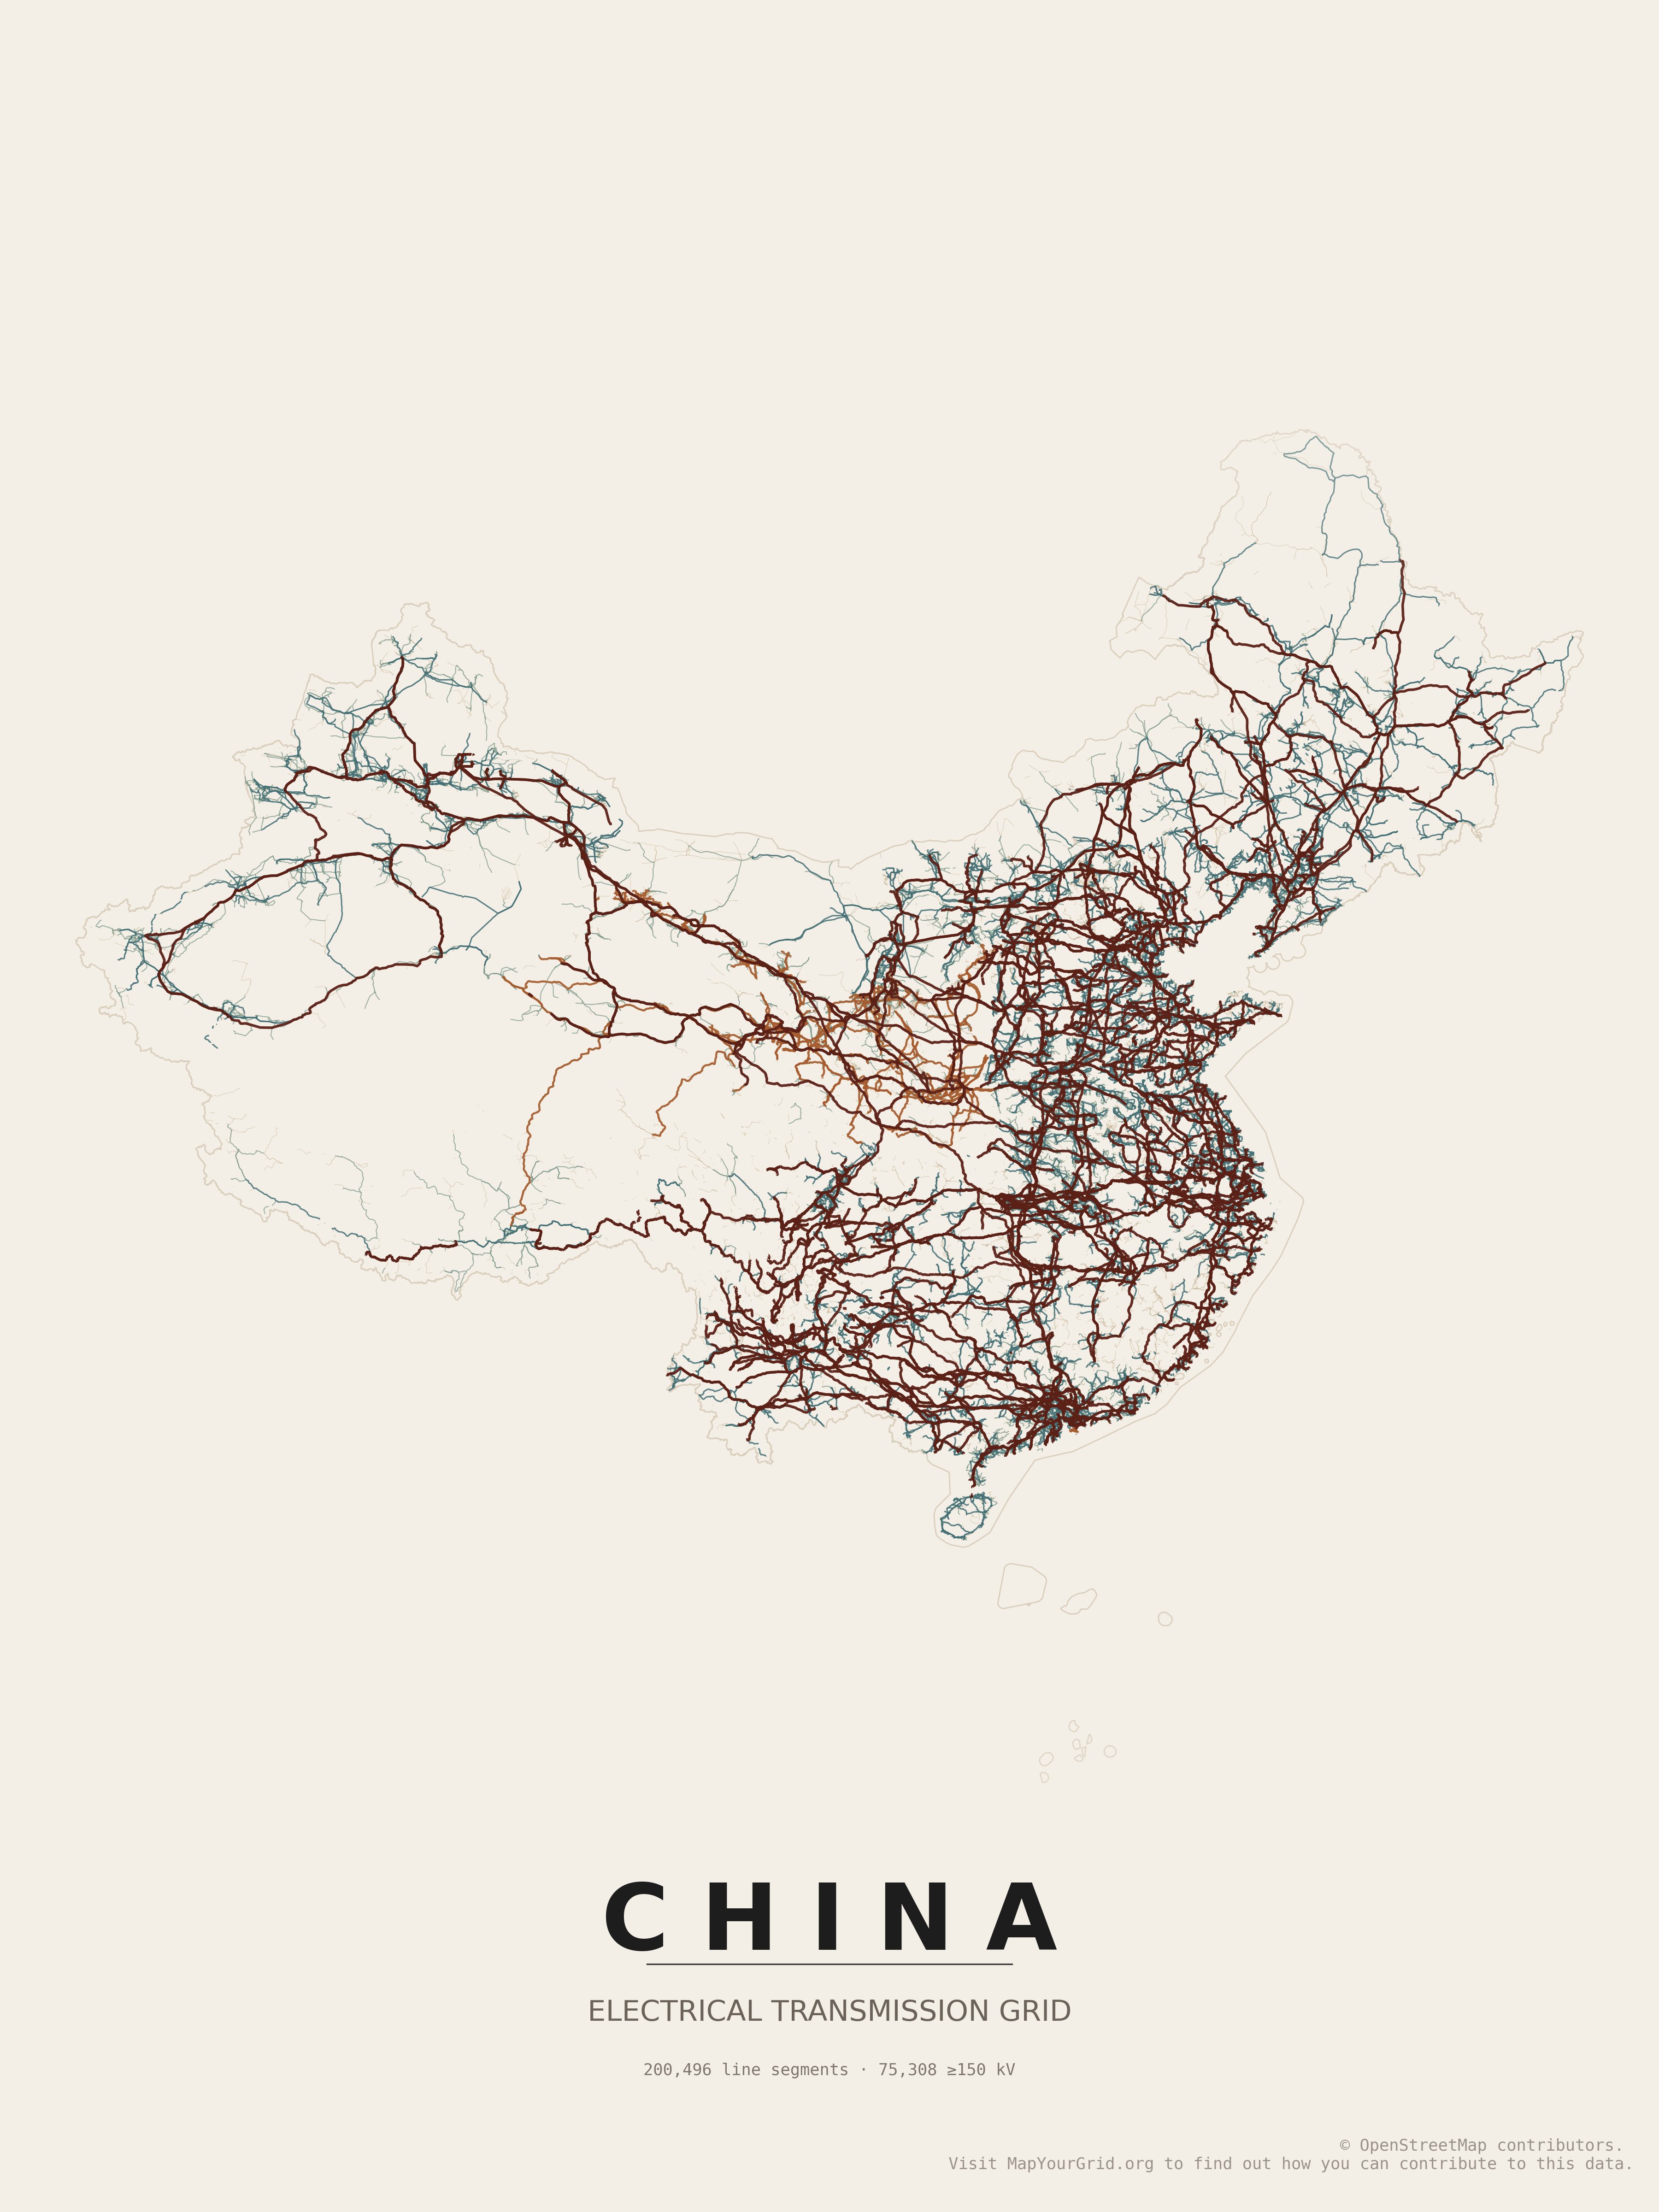 China's electrical grid in paper_grid theme
Getting Started with Grid2Poster
For those interested in using Grid2Poster, the setup is straightforward:
- Create a Python virtual environment
- Install the requirements with
pip install -r requirements.txt - Run the script with basic parameters like
python create_grid_poster.py --country Portugal
The project supports numerous command-line options for customization, making it flexible for various use cases. The generated posters are saved to a posters/ directory by default, with intermediate data cached in a cache/ directory to avoid redundant downloads.
Conclusion
Grid2Poster represents a valuable contribution to the growing ecosystem of open-source tools for energy system visualization. By transforming complex OpenStreetMap data into accessible, visually appealing posters, the project helps bridge the gap between technical energy data and broader understanding.
As energy systems continue to evolve with increasing renewable integration and distributed generation, tools like Grid2Poster will become even more valuable for visualizing these transformations. The combination of open data, open-source software, and community collaboration offers a powerful approach to making energy infrastructure more transparent and understandable to diverse audiences.
For energy professionals, researchers, educators, and engaged citizens, Grid2Poster provides a new lens through which to view and understand the invisible networks that power modern society.
Comments
Please log in or register to join the discussion