Microsoft introduces Browser Activity Logs in Playwright Workspaces, providing centralized visibility into cloud browser usage, cost tracking, and lifecycle management for test automation and AI-driven workflows.
Microsoft has unveiled a new feature for Playwright Workspaces that provides comprehensive visibility into cloud browser usage through Browser Activity Logs. This enhancement addresses the growing need for observability and cost management as organizations scale their browser-based automation and testing workflows.
Understanding Browser Sessions in Playwright Workspaces
In Playwright Workspaces, a Browser Session represents any browser instance provisioned by the service, regardless of how it was initiated. This includes browsers started by:
- Playwright Workspaces test runs
- Browser Automation Tool
- Other automation clients connecting to the workspace
Every time a browser is requested, Playwright Workspaces automatically creates a Browser Session and records it in the Browser Activity Logs within the Azure portal. This ensures that all browser usage—whether for testing or other automation scenarios—is fully observable from a single centralized view.
What Browser Activity Logs Provide
The Browser Activity Logs page offers a comprehensive view of every cloud browser session's lifecycle, from creation to completion. For each session, users can access detailed information including:
- Session Name / ID – A unique identifier for the browser session
- Start Time and End Time – When the session began and concluded
- Billable Time – The total duration of the session that is billable
- Source Type – The client that initiated the session (Playwright Workspaces test run, browser automation tool, or others)
- Source ID – Identifier of the initiating client
- Status – Current state of the session (Created, Active, Completed, Failed)
- Browser Type – The specific browser used for the session
- Operating System – The OS used by the browser
- Creator Name / ID – The user who initiated the session
These fields provide end-to-end traceability for every browser instance created in your workspace.
Filtering and Analyzing Usage Patterns
The Browser Activity Logs page includes built-in filters that enable quick analysis of usage patterns. Users can filter browser sessions by:
- Time range: Last 30 days, 60 days, or 90 days
- Source type: Playwright Workspaces test runs, browser automation tools, or other sources
- Source ID: Test run ID or conversation ID
- Status: Created, Active, Completed, or Failed
These filters make it easy to answer critical questions such as:
- How many browser sessions were created by a specific test run?
- Which automation scenarios are consuming the most browser time?
- How much billable browser time was used in a given period?
Accessing Browser Activity Logs
To view Browser Activity Logs in the Azure portal, users need:
- An Azure account with an active subscription
- Owner, Contributor, or classic administrator role on the subscription
- A Playwright Workspace created in the subscription
- Reader, Contributor, or Owner access to the Playwright Workspace
Step-by-step access:
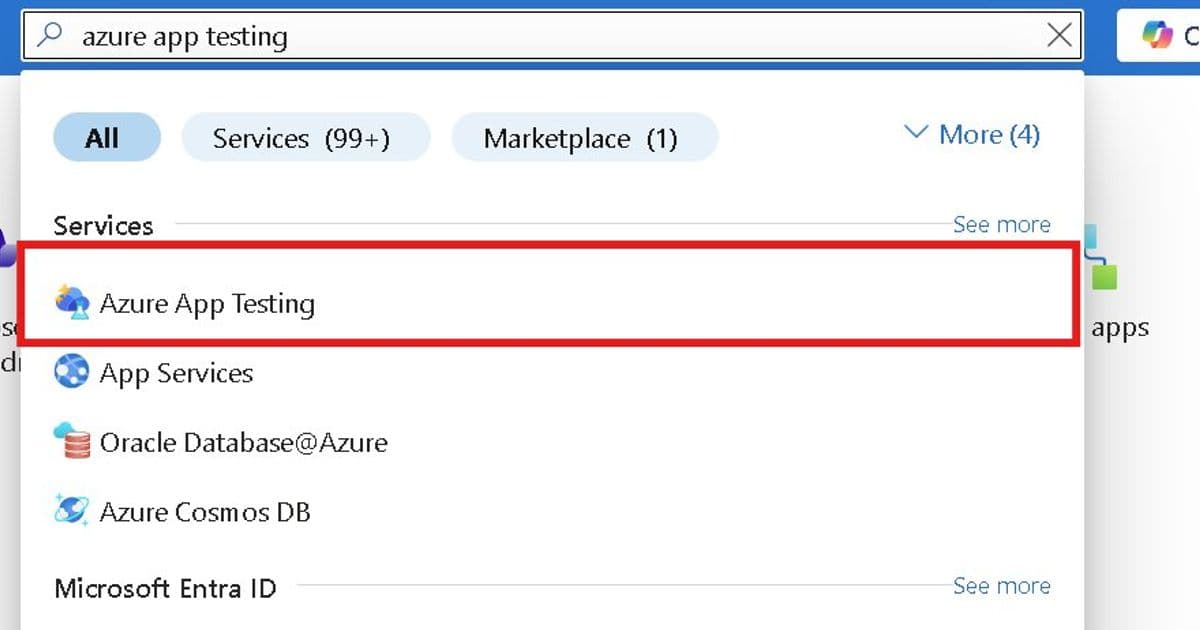
- Sign in to the Azure portal
- Search for and select "Azure App Testing"
- In the Azure App Testing hub, select "View resources" under Playwright Workspaces
- Search for and open your Playwright Workspace
- In the left navigation pane, select "Browser sessions" → "Browser activity log"
- Click on any Browser session to see additional details
- Use the Source ID filter to narrow down results (e.g., enter a test run ID or Foundry conversation ID)
Key Benefits for Teams
Browser Activity Logs unlock three critical benefits for teams using Playwright Workspaces:
Visibility – See every browser session created across testing and automation scenarios Traceability – Correlate browser usage back to test runs, tools, or conversations Cost transparency – Understand billable browser time and optimize usage as you scale
Whether you're debugging a failed automation workflow, reviewing usage across teams, or tracking costs, Browser Activity Logs provide the clarity needed for effective management.
Getting Started
Browser Activity Logs in Playwright Workspaces is now available for all Playwright Workspace users. To learn more and start exploring your browser usage, visit the Azure portal and navigate to the Browser Activity Log page in Playwright Workspaces.
This feature represents a significant step forward in cloud browser management, providing teams with the tools they need to scale their automation workflows while maintaining visibility and control over costs.
For more information about Playwright Workspaces and related Azure testing services, visit the Microsoft Playwright Workspaces documentation.
Comments
Please log in or register to join the discussion