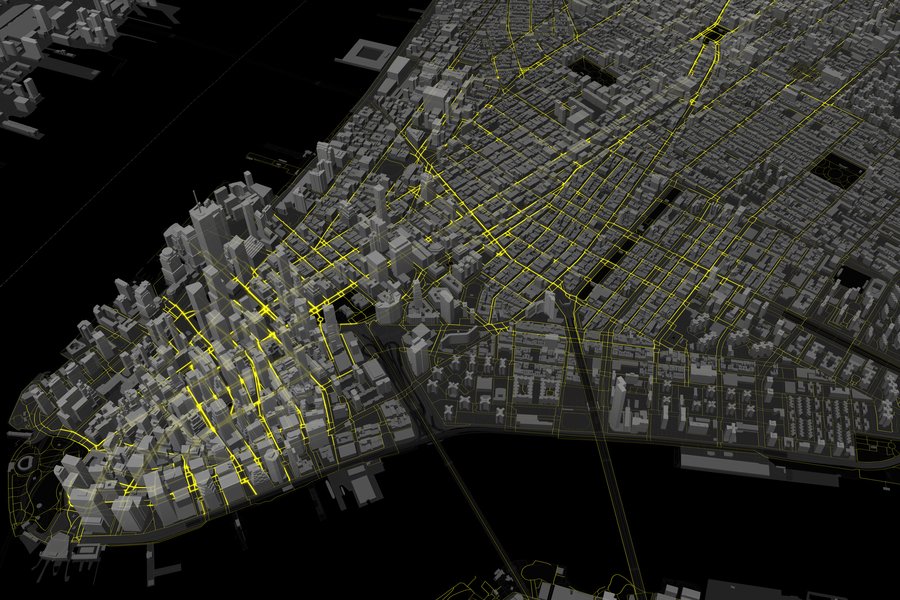
MIT researchers have created the first complete model of pedestrian traffic in any U.S. city, mapping sidewalks, crosswalks, and footpaths across all five boroughs of New York City to inform infrastructure decisions and safety improvements.
An MIT research team has completed what they describe as the first comprehensive mapping of pedestrian traffic in any U.S. city, creating a detailed model of sidewalks, crosswalks, and footpaths across all five boroughs of New York City. The project, led by Associate Professor Andres Sevtsuk of MIT's Department of Urban Studies and Planning, provides city planners with unprecedented data about where people actually walk—information that has traditionally been overshadowed by vehicle traffic measurements.

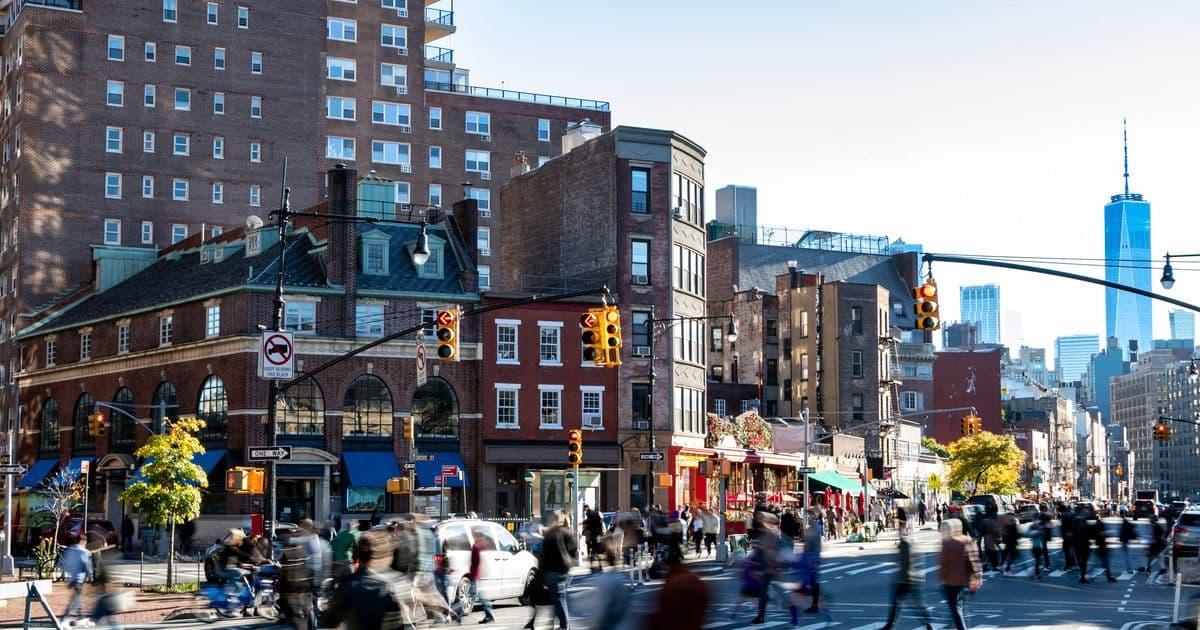
The study reveals that while Midtown Manhattan has the highest concentration of foot traffic in the city, with approximately 1,697 pedestrians per sidewalk segment per hour during evening peak times, many other neighborhoods across the city's boroughs also experience substantial pedestrian volumes that have been largely overlooked in planning decisions.
"We now have a first view of foot traffic all over New York City and can check planning decisions against it," Sevtsuk explains. "New York has very high densities of foot traffic outside of its most well-known areas."
The data shows that neighborhoods like Brooklyn Heights, University Heights in the Bronx, and parts of Queens have pedestrian volumes comparable to many Manhattan areas, yet have historically received less investment in pedestrian infrastructure. Brooklyn Heights, for instance, averages 277 pedestrians per sidewalk segment per hour, while University Heights in the Bronx sees 263 pedestrians during peak times.

Beyond simply mapping where people walk, the model incorporates multiple factors to estimate pedestrian volumes across the entire city, not just at the limited locations where official counts have been conducted. The researchers calibrated their model using pedestrian count data collected by New York City's Department of Transportation in 2018 and 2019, which covered up to 1,000 sidewalk segments on weekdays and approximately 450 segments on weekends.
One of the study's most significant contributions is its approach to measuring pedestrian safety. Rather than simply counting total vehicle crashes involving pedestrians, the model calculates accidents per pedestrian, providing a more accurate picture of risk. This approach reveals that some of the city's most dangerous intersections for pedestrians are not necessarily those with the highest total crash numbers.
"Places like Times Square and Herald Square in Manhattan may have numerous crashes, but they have very high pedestrian volumes, and it's actually relatively safe to walk there," says Rounaq Basu, an assistant professor at Georgia Tech and one of the study's co-authors. "There are other parts of the city, around highway off-ramps and heavy car-infrastructure, including the relatively low-density borough of Staten Island, which turn out to have a disproportionate number of crashes per pedestrian."
The model also provides insights into pedestrian travel patterns throughout the day. Morning peak traffic is dominated by trips to work and school, with transit stops serving as major generators of foot traffic. Evening patterns are more varied, reflecting social activities, errands, and family-related trips.
"Because of jobs, transit stops are the biggest generators of foot traffic in the morning peak," notes Liu Liu, a PhD student at MIT's City Form Lab. "In the evening peak, of course people need to get home too, but patterns are much more varied, and people are not just returning from work or school."
The research team, which includes Abdulaziz Alhassan, a PhD student at MIT's Center for Complex Engineering Systems, and Justin Kollar, a PhD student at MIT's Leventhal Center for Advanced Urbanism, sees broad applications for their modeling approach beyond New York City. They are currently working with officials in Los Angeles to prepare for the 2028 Summer Olympics and with the state of Maine to evaluate pedestrian movement in over 140 cities and towns.
Sevtsuk emphasizes that the tools and methodologies developed for this study can be applied to cities and towns anywhere in the United States. The work represents a shift in urban planning priorities, moving away from the car-centric approach that dominated much of the 20th century toward a more balanced consideration of pedestrian mobility.
"I hope this can inspire other cities to invest in modeling foot traffic and mapping pedestrian infrastructure as well," Sevtsuk says. "Very few cities make plans for pedestrian mobility or examine rigorously how future developments will impact foot-traffic. But they can. Our models serve as a test bed for making future changes."
The study, published in Nature Cities, arrives at a time when cities across the United States are increasingly focused on reducing carbon emissions and creating more walkable, livable urban environments. By providing detailed, data-driven insights into pedestrian behavior and safety, the MIT model offers a practical tool for planners seeking to make cities more pedestrian-friendly while addressing the urgent need to decarbonize urban transportation.
The complete mapping of New York City's pedestrian infrastructure represents a significant milestone in urban planning, demonstrating that comprehensive pedestrian data collection is not only possible but can yield valuable insights that challenge conventional assumptions about where people walk and what infrastructure investments are most needed.
Comments
Please log in or register to join the discussion