Josef Bacik's Rust-based Systing 1.0 integrates Claude Code AI to revolutionize eBPF tracing, replacing manual script analysis with intelligent, real-time insights for Linux system debugging and performance optimization.
Systing 1.0: AI-Powered eBPF Tracing Tool Redefines System Performance Analysis

Josef Bacik, the former Meta engineer and Btrfs developer, has unveiled Systing 1.0, marking a significant evolution in Linux system tracing tools. The release represents a fundamental shift from traditional eBPF-based performance analysis toward an AI-integrated approach that promises to transform how developers debug and optimize system performance.
The tool's journey began as a straightforward eBPF tracer designed to generate Perfetto traces for system behavior analysis. However, the 1.0 release introduces what Bacik describes as a "new AI identity," fundamentally reimagining the tool's purpose and capabilities. This transformation centers on integrating Claude Code, Anthropic's AI coding assistant, directly into the tracing workflow.
From Manual Scripts to AI-Powered Analysis
Traditionally, analyzing system traces required developers to write custom scripts, manually parse data, and spend considerable time correlating events across different system components. Systing 1.0 eliminates much of this manual labor by feeding DuckDB-based traces directly into Claude Code for real-time analysis.
The shift from Perfetto traces to DuckDB databases represents a strategic technical decision. DuckDB's columnar storage format and SQL query capabilities make it significantly easier to query and analyze large volumes of trace data. This architectural change enables Systing to process complex queries efficiently while maintaining the rich contextual information needed for meaningful system analysis.
Real-Time AI Analysis Capabilities
With Systing 1.0, developers can ask Claude Code questions about their system traces in natural language and receive immediate, contextually relevant answers. This capability transforms the debugging process from a time-consuming manual investigation into an interactive dialogue with the system's performance data.
The AI integration goes beyond simple query answering. Claude Code can identify patterns, correlate events across different system layers, and suggest potential optimizations based on the trace data. This represents a significant advancement over traditional static analysis tools that merely present raw data without intelligent interpretation.
Practical Applications and Case Studies
Bacik has already demonstrated Systing's effectiveness in real-world scenarios. The tool has been successfully used to improve the performance of a networking application, showcasing its ability to identify bottlenecks and suggest optimizations that might not be apparent through conventional analysis methods.
Another notable application involved debugging a performance regression. In this case, Systing's AI capabilities enabled rapid identification of the root cause, significantly reducing the time typically required for such investigations. The ability to ask targeted questions about specific performance metrics and receive immediate insights proved invaluable in this debugging scenario.
Technical Architecture and Implementation
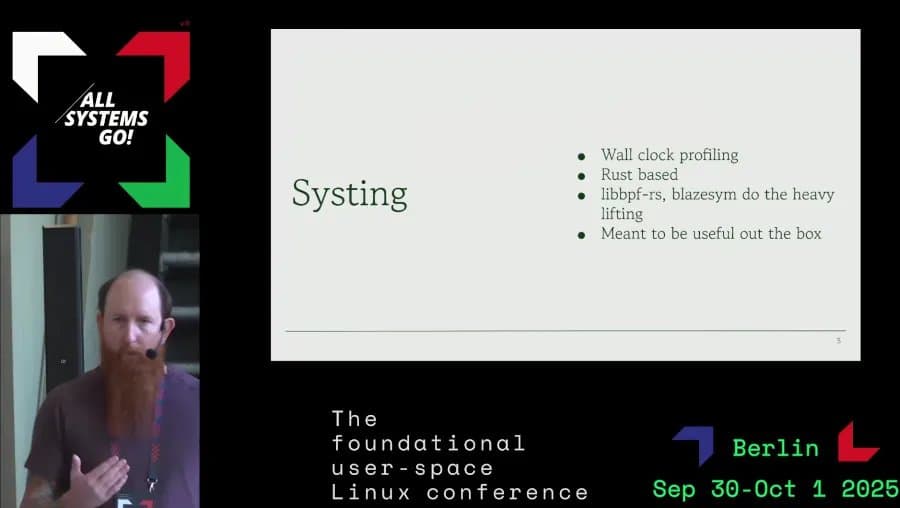
The Rust-based implementation leverages libbpf for eBPF program management, ensuring compatibility with modern Linux kernels while maintaining performance efficiency. The choice of Rust provides memory safety guarantees and eliminates many common programming errors that could compromise the reliability of a system-level tracing tool.
The integration with Claude Code represents a novel approach to combining AI capabilities with low-level system analysis. By feeding structured trace data into an AI model capable of understanding complex system behaviors, Systing bridges the gap between raw performance data and actionable insights.
Developer Experience and Workflow Integration
Bacik's vision for Systing extends beyond mere performance analysis. He describes the tool as the "closest thing to what I've always had in my head of the perfect tool," emphasizing its role in streamlining the entire debugging workflow. The AI integration transforms Systing from a passive data collection tool into an active assistant that helps developers understand and optimize their systems.
The tool's development reflects Bacik's broader perspective on system analysis. Rather than treating tracing as a separate, specialized activity, Systing aims to integrate performance analysis seamlessly into the development workflow. This approach recognizes that effective system optimization requires continuous feedback and rapid iteration.
Future Directions and Community Impact
The release of Systing 1.0 opens new possibilities for system analysis tools. By demonstrating the practical value of AI integration in low-level performance analysis, Bacik has potentially set a new standard for how developers approach system debugging and optimization.
The tool's availability on GitHub invites community participation and extension. As developers begin to explore Systing's capabilities, new use cases and optimizations are likely to emerge, further expanding the tool's utility and impact on the Linux development ecosystem.
Technical Context and Industry Implications
Systing's approach aligns with broader industry trends toward AI-assisted development tools. However, its focus on system-level performance analysis represents a unique application of AI technology. While many AI coding tools focus on application-level code generation and review, Systing demonstrates how AI can enhance understanding of complex system behaviors and interactions.
The tool's success could influence the development of other system analysis tools, encouraging more integration of AI capabilities into traditionally manual analysis workflows. This shift could lead to more efficient debugging processes and faster identification of performance issues across the Linux ecosystem.
Getting Started with Systing 1.0
Developers interested in exploring Systing can access the Rust-based code through GitHub. The tool requires a modern Linux kernel with eBPF support and builds upon the libbpf library for eBPF program management. The DuckDB integration means users will need to familiarize themselves with SQL-based query approaches for trace data analysis.
Bacik's presentation at the All Systems Go conference provides additional context and demonstrates the tool's capabilities in action. The YouTube recording offers insights into the tool's development philosophy and practical applications, serving as a valuable resource for developers considering Systing for their performance analysis needs.
Conclusion: A New Paradigm for System Analysis
Systing 1.0 represents more than just an incremental improvement in tracing tools. It embodies a fundamental shift in how developers approach system performance analysis, moving from manual, script-based investigation to AI-assisted, interactive exploration of system behavior.
The tool's success in real-world applications, combined with its innovative technical approach, positions it as a potentially transformative addition to the Linux developer's toolkit. As AI capabilities continue to evolve and integrate with system-level tools, Systing may well represent the beginning of a new era in performance analysis and system optimization.
For developers struggling with complex performance issues or seeking to optimize their applications at the system level, Systing 1.0 offers a compelling new approach. By combining the precision of eBPF tracing with the analytical power of AI, it promises to make system performance analysis more accessible, efficient, and effective than ever before.
Comments
Please log in or register to join the discussion