
A mathematical function called the Mills ratio exposes a fundamental difference between the Student t and normal distributions, showing why the common approximation of t(30) as normal breaks down in the extreme tails.
The Mills ratio, defined as the ratio of the complementary cumulative distribution function (CCDF) to the probability density function (PDF), provides a powerful lens for understanding tail behavior in probability distributions. For a random variable X with density function f, the Mills ratio at point x is given by R(x) = (1 - F(x)) / f(x), where F is the cumulative distribution function. This seemingly simple ratio reveals profound differences between distributions that appear similar in the center but diverge dramatically in the tails.
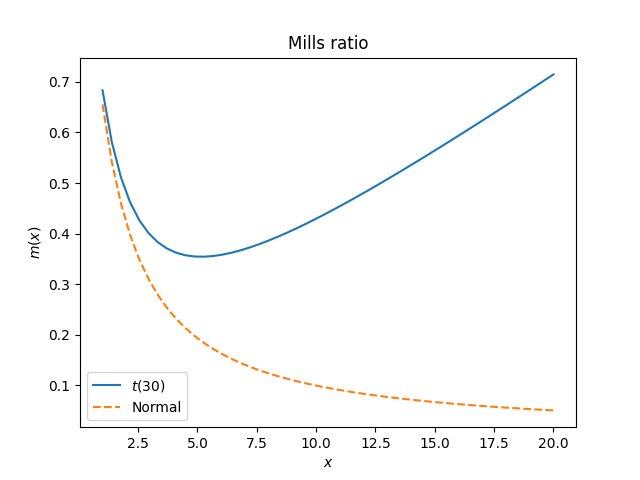
The Mills ratio for a Student t distribution with ν degrees of freedom behaves asymptotically as x/ν for large x, while the Mills ratio for a standard normal distribution decays as 1/x. This fundamental distinction explains why the common statistical advice to approximate a t distribution with a normal when ν > 30 is misleading for tail-dependent applications. While t(30) and normal distributions share similar central characteristics, their tail behaviors are qualitatively different: the t distribution's Mills ratio grows linearly, indicating heavier tails, whereas the normal's Mills ratio decays, reflecting light tails.
The mathematical behavior of the Mills ratio classifies distributions by tail thickness. For thin-tailed distributions like the normal, the Mills ratio decreases as x increases, meaning the probability of extreme events decays faster than the density. For fat-tailed distributions like the t distribution, the Mills ratio increases, indicating that extreme events are more probable relative to the density. The exponential distribution sits at the boundary with a constant Mills ratio, representing the transition between tail types.
This distinction has practical implications for statistical modeling and risk assessment. In finance, where extreme events matter more than central tendencies, using normal approximations for t-distributed data can severely underestimate tail risk. In quality control, the probability of extreme defects follows different patterns depending on the underlying distribution. The Mills ratio provides a quantitative way to assess whether a normal approximation is appropriate for a given application.
The asymptotic behavior of the Mills ratio also connects to the single big jump principle in heavy-tailed distributions. For distributions with linearly growing Mills ratios, the probability of observing a large deviation is dominated by single extreme events rather than accumulated small deviations. This principle appears in fields ranging from network traffic analysis to climate modeling, where understanding tail behavior is crucial for predicting rare but impactful events.
The Mills ratio's sensitivity to distribution tails makes it valuable for statistical diagnostics. By comparing empirical Mills ratios from data to theoretical values, analysts can assess whether their data follows a particular distribution, especially in the tails where traditional goodness-of-fit tests often lack power. This approach is particularly useful when validating assumptions about tail behavior in extreme value analysis.
The mathematical properties of the Mills ratio also appear in various statistical applications. In reliability engineering, the Mills ratio relates to hazard functions and failure rates. In Bayesian statistics, it appears in calculations involving truncated distributions. The ratio's monotonicity properties provide insights into distribution shapes and help in developing bounds for tail probabilities.
Understanding the Mills ratio challenges the common statistical practice of using normal approximations without considering tail behavior. While the central limit theorem guarantees normal approximations for sums of independent random variables, the rate of convergence depends on the underlying distribution's tail thickness. The Mills ratio quantifies this convergence rate and helps determine when normal approximations are adequate.
The distinction between thin-tailed and fat-tailed distributions, as revealed by the Mills ratio, extends beyond statistics into physics, economics, and engineering. In physics, fat-tailed distributions appear in systems with long-range correlations. In economics, they characterize market returns and insurance claims. In engineering, they model extreme weather events and system failures. The Mills ratio provides a unified framework for analyzing tail behavior across these diverse domains.
The Mills ratio's behavior also illuminates the limitations of the central limit theorem in practical applications. While the theorem guarantees convergence to normality, the Mills ratio shows that the convergence rate depends critically on the tail thickness of the original distribution. For heavy-tailed distributions, the convergence can be extremely slow, making normal approximations unreliable for tail probabilities even with large sample sizes.
This mathematical insight has practical consequences for statistical software and data analysis. When implementing statistical tests or confidence intervals, understanding the Mills ratio helps determine whether normal-based methods are appropriate. For distributions with linearly growing Mills ratios, alternative methods based on the actual distribution or robust approaches may be necessary.
The Mills ratio also appears in computational statistics, particularly in Monte Carlo methods for rare event simulation. The ratio's growth rate determines the efficiency of importance sampling techniques and helps design optimal sampling strategies for estimating tail probabilities.
In summary, the Mills ratio serves as a diagnostic tool for distribution tail behavior, revealing why the common t(30) approximation fails in the tails despite working well in the center. Its asymptotic behavior—linear growth for t distributions versus linear decay for normal distributions—provides a rigorous foundation for understanding when normal approximations are valid and when they break down. This understanding is crucial for applications where tail behavior matters more than central tendencies, from financial risk management to engineering reliability analysis.
Comments
Please log in or register to join the discussion