
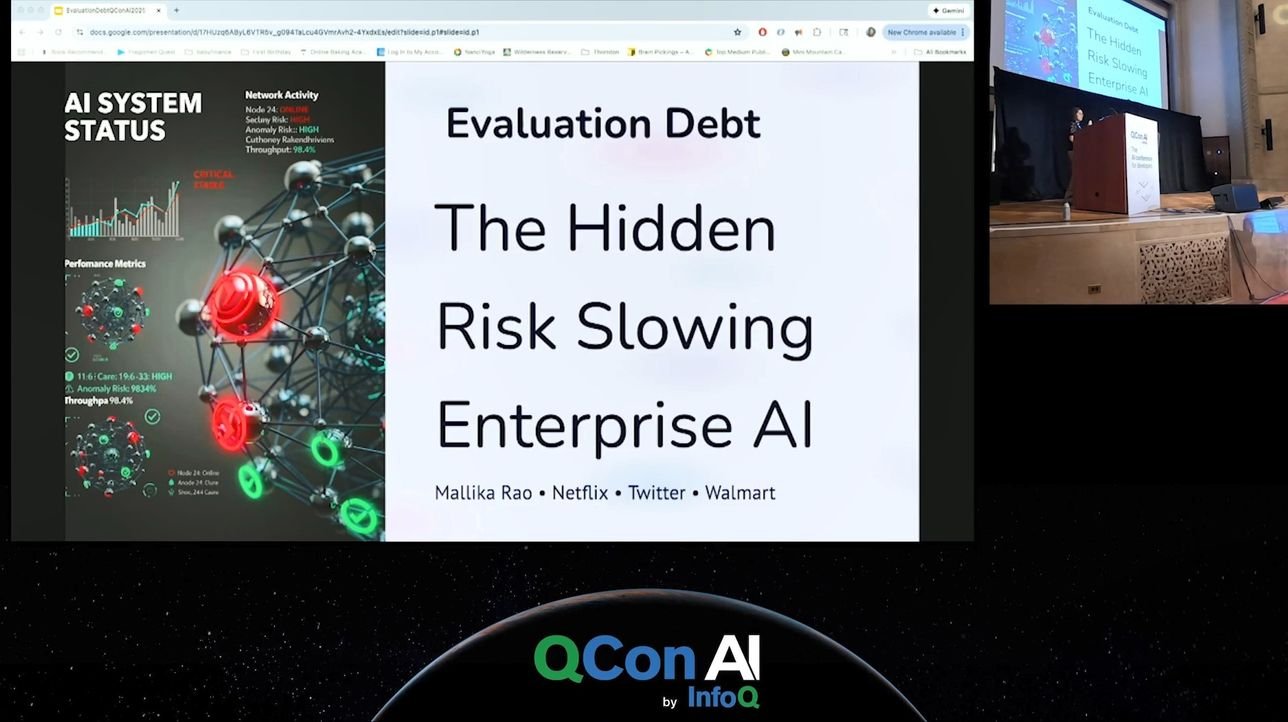
Mallika Rao explains why traditional model metrics fall short in production AI systems, introduces a five‑layer evaluation stack, and shares two real‑world case studies that illustrate the hidden cost of “evaluation debt”. A maturity model and a practical toolkit help engineering leaders align infrastructure, product guardrails, user experience and long‑term trust.
Building Evaluation Frameworks for AI Adoption: From Principles to Practice
InfoQ – QCon AI 2026
Presented by Mallika Rao – former engineering leader at Twitter, Walmart and Netflix

Service update → Use cases → Trade‑offs
1. Why a new evaluation stack matters
Traditional AI pipelines still rely on static precision/recall scores, latency graphs and occasional manual spot‑checks. Those metrics were sufficient when models were isolated, but today’s production systems combine LLMs, vector stores, multi‑stage agents and real‑time personalization. The gap between what the dashboards show (green) and what users experience (confused, mistrusting) is what Mallika calls evaluation debt.
Key symptoms of that debt:
- Silent regressions – metrics stay healthy while support tickets rise.
- Impossible failures – edge‑case bugs that never appear in staging.
- Edge‑case explosion – each release uncovers a new class of semantic errors.
- Long‑term decay – trust metrics drift down quarter after quarter.
If the evaluation stack does not evolve with the product stack, the debt accumulates silently and can explode spectacularly.
2. The five‑layer evaluation stack
| Layer | Focus | Typical tooling |
|---|---|---|
| 1 – Model correctness | Classic metrics (precision, recall, F1) on a held‑out test set. | scikit‑learn, evaluate library, CI unit tests |
| 2 – Infrastructure robustness | End‑to‑end latency, P95/P99, service health, resource usage. | OpenTelemetry, Prometheus, Grafana dashboards |
| 3 – Product guardrails | Semantic plausibility, harmful output detection, business rule enforcement. | Custom rule engines, LLM‑as‑judge pipelines, policy‑as‑code (OPA) |
| 4 – Human experience | UI consistency, explainability, perceived trust, accessibility. | A/B test platforms, UX research tools, synthetic user journeys |
| 5 – Systemic impact | Long‑term business metrics – churn, compliance, privacy, brand trust. | Event‑level analytics, cohort analysis, governance dashboards |
Most organizations only reach layers 1 and 2. The most resilient teams cover all five and iterate the stack as product surfaces evolve.
3. Traditional metrics that now fail
- Contamination crisis – Public benchmarks (e.g., MMLU) are often part of a model’s training data, inflating scores. Companies now maintain private, quarterly‑refreshing evaluation sets.
- Agentic pipelines – Success is multiplicative; an 8‑step agent with 95 % per‑step accuracy yields only ~66 % overall success. Metrics must capture goal achievement rather than per‑step precision.
- LLM‑as‑judge bias – Relying solely on an LLM for labeling introduces style and length biases. A three‑tier approach (golden human set → LLM‑scaled labeling → periodic human audit) provides a more reliable signal.
4. Case study 1 – Personalized search at Twitter
Problem: A new semantic search layer replaced a pure Lucene keyword index. The system handled billions of queries with sub‑100 ms latency budgets across multiple data centers.
Evaluation debt symptoms
- Model metrics (Layer 1) were excellent, but users reported irrelevant results.
- Infrastructure (Layer 2) stayed within SLA, yet the product guardrails (Layer 3) missed semantic intent checks.
- UX (Layer 4) showed a mismatch between displayed results and user expectations, eroding trust.
Resolution
- Align evaluation with product reality – collaborated with product, design and research to define a discovery‑quality metric that weights freshness and relevance.
- Stratified evaluation – high‑intent queries required ≥ 90 % accuracy, exploratory queries were allowed a lower threshold.
- Proxy signals for expensive features – used lightweight user‑history sketches instead of full history to stay within latency budgets.
- Iterative sync – evaluation frameworks were updated every sprint alongside product releases.
Outcome: The revised stack caught semantic regressions before release, user satisfaction stabilized, and the trust decay curve flattened.
5. Case study 2 – Walmart Rewards cash‑back program
Problem: A nationwide rewards balance displayed zero for users in Louisiana due to a tax‑withholding rule that existed only in the UI layer. Backend calculations (Layers 1 & 2) were correct, but the product guardrails (Layer 3) and UX (Layer 4) failed.
Impact
- Call‑center volume spiked by 0.2 % of users → ~50 k tickets per month.
- Redemption rate dropped from 68 % to 41 % (a 48 : 1 trust loss).
- Full recovery took over a year.
Remediation steps
- Add UI‑level guardrails – a validation layer that flags mismatched tax logic before rendering.
- Introduce a trust metric – daily monitoring of redemption‑rate drift.
- Human‑in‑the‑loop review – weekly UX audits that can block deployments if visual inconsistencies are found.
- Error taxonomy – cataloged the top 20 failure modes, enabling faster root‑cause analysis.
Result: Errors fell to 0.02 %, call‑center volume returned to baseline, and the redemption rate recovered to pre‑incident levels within six months.
6. Maturity model for evaluation debt
| Level | Description |
|---|---|
| 0 – YOLO | Test in production, reactive firefighting only. |
| 1 – Basic | Table‑stakes metrics (precision, recall, latency). |
| 2 – Multi‑layer | All five layers covered but still siloed. |
| 3 – Integrated | Cross‑team orchestration (engineering, product, design, research). |
| 4 – Adaptive | Continuous evolution of the stack matching product cadence; dedicated budget and governance. |
Most firms sit between 1 and 2. The diagnostic checklist helps teams identify the gap and prioritize investments.
7. Practical toolkit (the “Companion Toolkit”)
- Maturity assessment questionnaire – quick Monday‑morning audit.
- Five‑layer checklist – concrete items for CI pipelines, monitoring, guardrails, UX tests and trust metrics.
- Error taxonomy template – start with the top‑20 failure patterns for your domain.
- Evaluation‑debt audit script – run weekly to surface silent regressions.
- Adoption roadmap – phased plan (Week 0‑3) to move from level 1 to level 2.
All assets are available as a downloadable slide deck linked from the presentation page.
8. Key take‑aways (principles)
- Evaluation is a stack, not a single score.
- Silent regressions are inevitable; guardrails must be first‑class.
- Human‑in‑the‑loop is mandatory at every layer.
- Trust is a measurable layer, not an afterthought.
- The stack must evolve with the product – monthly cadence for fast‑moving AI features.
By treating evaluation as a living system, engineering leaders can keep AI‑driven products reliable, trustworthy and aligned with business goals.
9. Further reading & resources
- Official slide deck: https://infoq.com/presentations/eval-ai-adoption
- Mallika Rao’s blog on evaluation debt: https://blog.mallikar.com/eval-debt
- OpenTelemetry observability guide: https://opentelemetry.io/docs
- Guardrail patterns for LLMs (OPA): https://github.com/open-policy-agent/opa/tree/main/examples/llm-guardrails
Comments
Please log in or register to join the discussion