
GitHub Issues reduced perceived latency by moving data fetching to the client, adding an IndexedDB cache, a preheating strategy, and a service worker. The changes shifted most navigations into the instant bucket and cut median load time from 1.2 s to 0.7 s, while exposing trade‑offs around staleness and background capacity.
From latency to instant: Modernizing GitHub Issues navigation performance
When developers triage a backlog, each click is a context switch. Even a 200 ms pause feels like a break in flow, and repeated delays add up quickly. GitHub Issues was not “slow” in isolation; the problem was that many navigation paths still paid the full cost of data fetching and page boot, breaking flow again and again.
The problem: mixed navigation paths and a blunt metric
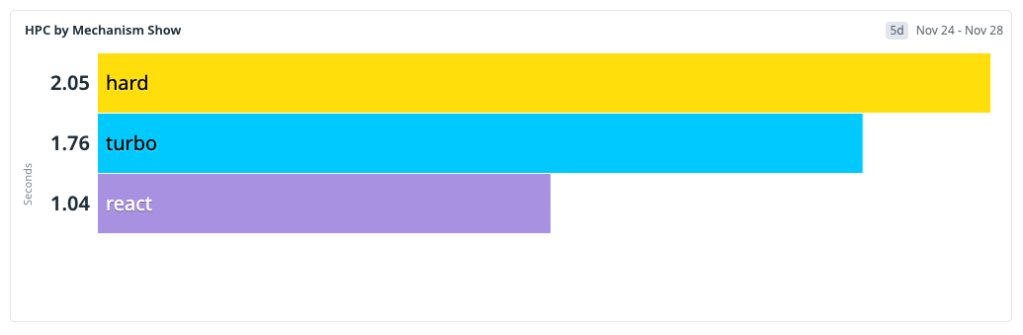
Issues pages are reached via three distinct routes:
- Hard navigation – a full page load (cold start or refresh). This path incurs network latency, server rendering, asset download, JavaScript boot and React hydration.
- Turbo navigation – a Rails Turbo transition that updates part of the page without a full reload, but still depends on a server‑rendered response.
- Soft navigation (React) – a client‑side transition inside an already‑running React runtime, where most of the boot cost is already paid.
At the start of the workstream the traffic mix was roughly:
- Hard navigation: 57 %
- Turbo navigation: 38 %
- Soft navigation: 5 %
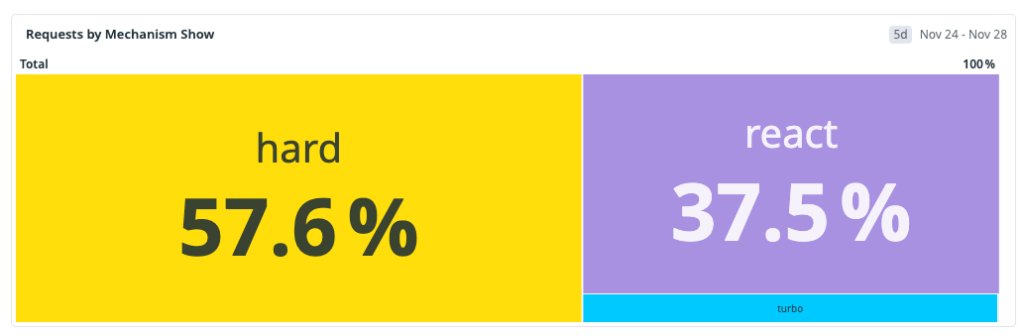
The dominant path was also the slowest, so optimizing only soft navigations would not move the overall distribution enough.
Defining “fast” for developers
We abandoned generic page‑load metrics and focused on HPC (Highest Priority Content), an internal analogue of Web Vitals LCP. HPC measures the time until the issue title or body appears on screen. We bucketed navigations as follows:
- Instant – HPC < 200 ms (feels immediate)
- Fast – HPC < 1 000 ms (acceptable but visible)
- Slow – HPC ≥ 1 000 ms
The goal became shifting the majority of navigations into the Instant or Fast buckets, not just improving the p99 tail.
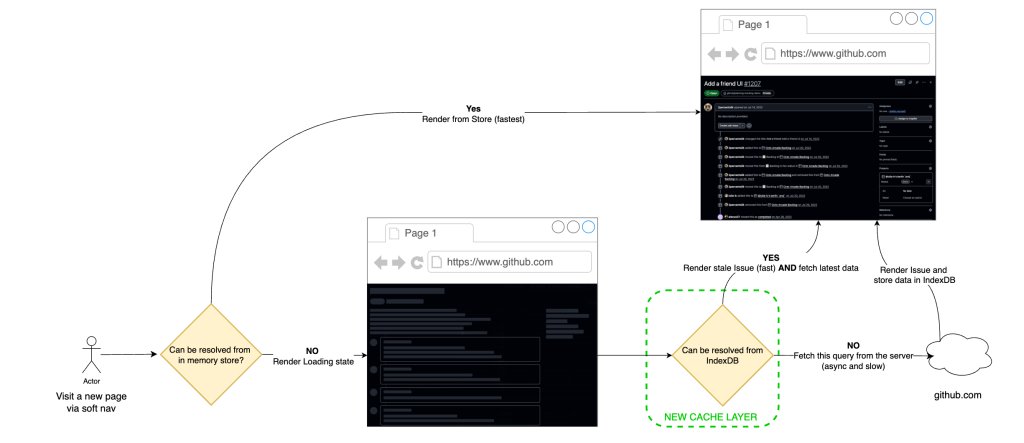
Solution approach: a local‑first data flow
Our strategy was to render from locally available data first, then revalidate in the background – a classic stale‑while‑revalidate (SWR) pattern. The implementation consisted of three layers:
- IndexedDB cache – durable storage that survives tab closes.
- In‑memory hot cache – synchronous reads for the critical path.
- Service worker – intercepts hard‑navigation requests and signals cache hits to the server.
Step 1 – IndexedDB‑backed SWR for soft navigations
We extended the existing in‑memory store with a persistent layer in IndexedDB. On a soft navigation the client:
- Reads the issue payload from the hot cache (or IndexedDB if not in memory).
- Renders immediately.
- Fires a background fetch to obtain the freshest data and updates the store if it differs.
Because IndexedDB survives restarts, a user who revisits the same issue after closing the browser still receives an instant render. The initial rollout showed a 22 % instant rate for React navigations (up from 4 %) and a cache‑hit ratio of ≈33 %.
Step 2 – Preheating to raise the hit ratio
A naïve prefetch of every linked issue would explode request volume. Instead we introduced preheating: a low‑priority worker walks high‑intent references (issue lists, dashboards, project boards) and populates the cache only if the payload is missing. This avoids redundant network traffic and respects capacity limits.
Preheating runs behind the scenes, is rate‑limited, and backs off under load, so it never competes with user‑initiated requests.
After a full rollout the cache‑hit ratio rose to ≈96 % for soft navigations, and ≈70 % of those navigations landed in the Instant bucket.
Step 3 – Service worker for hard and Turbo navigations
Hard navigations cannot rely on an already‑running JavaScript runtime. A service worker sits between the browser and the network, allowing us to apply the same local‑first model without page code.
When the service worker sees a request for issues/<id>, it checks the cache:
- Cache hit – the worker adds a custom header (
X‑GitHub‑Cache‑Hit: true). The server then returns a minimal HTML shell; the client hydrates from the cached payload. - Cache miss – the request proceeds normally and the server performs a full SSR.
Turbo navigations benefit immediately because the server can skip expensive data fetching when the header is present.
To keep the JavaScript bundle small on cold starts, we split route code with React.lazy and load heavy modules (e.g., the editor) only on demand. Intent‑based prefetching (hover) further hides latency without inflating the initial payload.
Trade‑offs and operational considerations
| Aspect | Benefit | Cost / Complexity |
|---|---|---|
| IndexedDB cache | Instant render for repeat visits, graceful degradation on flaky networks | Added asynchronous read path, need to handle version migrations |
| Preheating | Drives hit ratio to >90 % without overloading backend | Requires background workers, rate limiting, circuit‑breaker logic |
| Service worker | Reduces server work for hard navigations, improves Turbo latency | Browser support variance, extra caching layer to keep in sync |
| Stale‑while‑revalidate | Improves perceived speed, tolerates temporary inconsistency | Small window (≈4.7 %) where UI may show out‑of‑date data; mitigated by background reconciliation |
Overall the trade‑offs are acceptable: developers gain a noticeably faster flow, while the system tolerates a modest amount of stale data that is quickly corrected.
Results: a shifted latency distribution
We measured HPC percentiles across the full rollout period:
- P10: 600 ms → 70 ms
- P25: 800 ms → 120 ms
- P50: 1 200 ms → 700 ms
- P75: 1 800 ms → 1 400 ms
- P90: 2 400 ms → 2 100 ms
The biggest gains appear in the lower percentiles, where cached and preheated navigations now dominate. The median crossed below the one‑second threshold, moving from slow to fast. The upper tail still contains cold‑start traffic, indicating the next target for optimization.
What’s next
Cold starts remain the primary bottleneck. Our next phase will:
- Rewrite hot backend paths to emit ultra‑light JSON blobs that the client can hydrate directly, further shrinking the server‑side work.
- Deploy an edge‑proxied UI layer to reduce round‑trip latency for the initial JavaScript bundle.
- Continue refining preheating heuristics using telemetry‑driven intent signals, ensuring we only preheat the most likely next issues.
Performance is a continuous systems investment. By iterating on caching, preheating, and service‑worker orchestration we have moved a large share of traffic into the Instant bucket, and we will keep tightening the remaining slow paths.
Quickstart guide – see the GitHub Issues performance guide for implementation details.
Related engineering posts:
Alexander Lelidis is a senior software engineer on the GitHub Issues team. He has a background in computer graphics, machine learning, and geospatial software, and enjoys finding creative ways to make developer workflows feel instant.
Comments
Please log in or register to join the discussion