NetVisor emerges as a powerful open-source solution that automatically scans networks, maps infrastructure relationships, and generates interactive topology visualizations. This tool eliminates manual documentation headaches by dynamically discovering hosts, services, and connections across subnets.
The End of Network Diagram Nightmares? NetVisor Automates Infrastructure Visualization
Network documentation is the bane of every infrastructure engineer's existence—manually tracking IP addresses, service dependencies, and subnet relationships across dynamic environments. Enter NetVisor, an open-source toolkit that automates network discovery and generates living visual documentation. By combining active scanning with intelligent consolidation, it creates interactive topology maps that evolve with your infrastructure.
How NetVisor Works: Daemons, Discovery, and Docker
NetVisor operates through a distributed architecture:
- Daemon Process: Installed directly on Linux/macOS hosts (bypassing containers for raw network access), it scans all IPv4 subnets on connected interfaces. Using pattern matching, it detects services through open ports, HTTP responses, and interface configurations.
- Visualization Server: Runs via Docker Compose or from source (Rust/Node.js), aggregating data from multiple daemons to build unified topology views.
# Deployment in three commands:
curl -O https://raw.githubusercontent.com/.../docker-compose.yml
docker compose up -d
curl -sSL https://.../install.sh | bash
netvisor-daemon --server-target YOUR_SERVER_IP
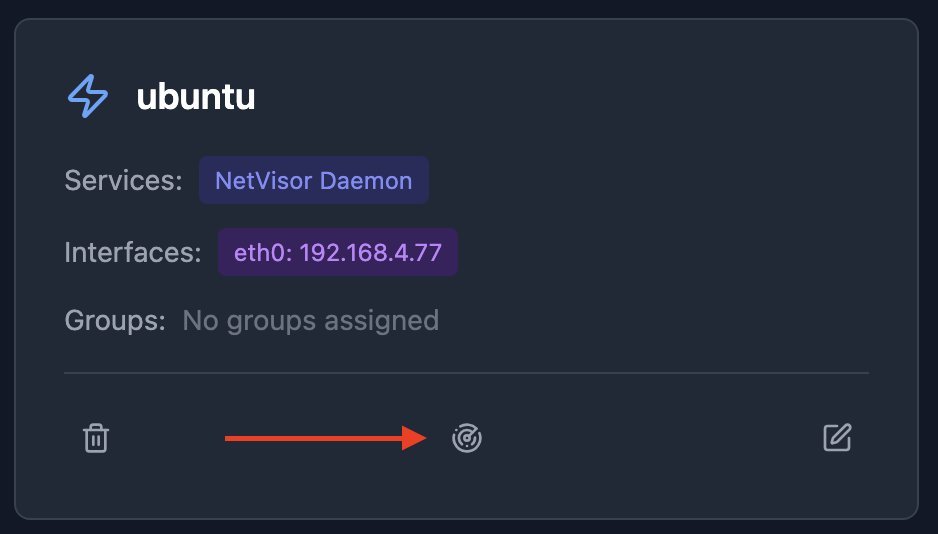 Discovery initiates with a single click after daemon registration, scanning every IP in connected subnets.
Intelligent Network Mapping Capabilities
Automatic Relationship Detection
During 5-10 minute discovery cycles (duration depends on subnet size), NetVisor:
- Identifies hosts and their network interfaces
- Detects services (DNS, gateways, proxies) through response analysis
- Automatically groups devices into subnets based on CIDR ranges
Manual Refinement Tools
- Host Consolidation: Merges interfaces/services scattered across duplicate host records
- Logical Grouping: Manually define service relationships (e.g., web app → database clusters)
- External Resource Mapping: Use 0.0.0.0/0 subnets to include cloud/remote assets
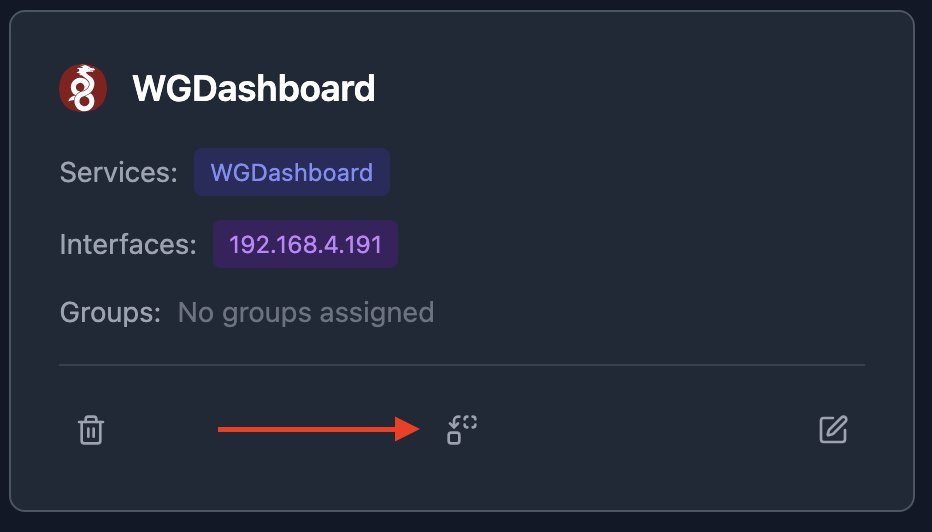 Consolidation migrates ports and services to correct host records after discovery.
Interactive Topology Customization
The generated visualization isn't static—engineers can:
- Reposition nodes via drag-and-drop
- Adjust subnet boundary sizes
- Reroute connection anchor points
- Toggle service group visibility
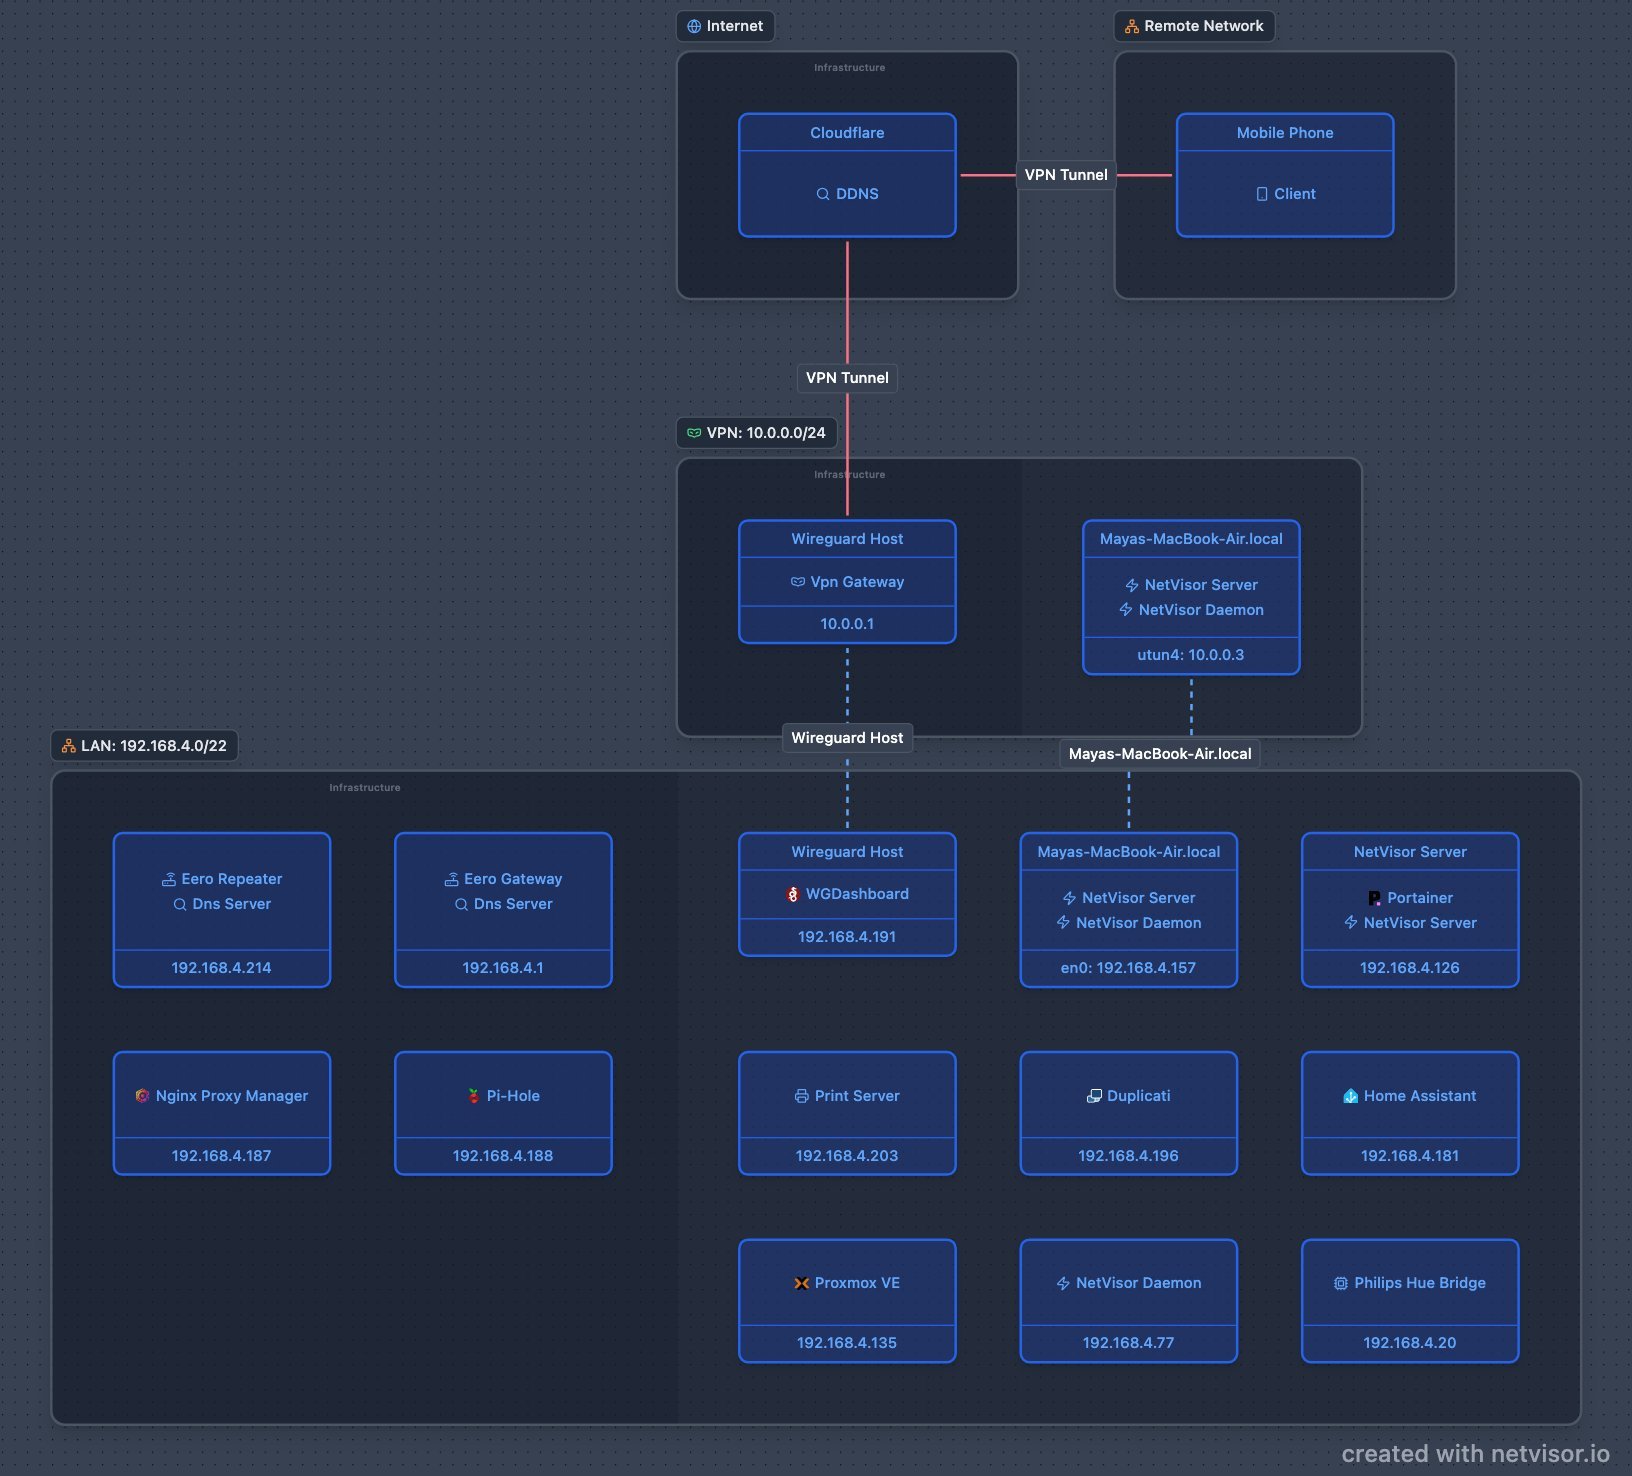 Dynamic visualization adapts as networks evolve, with manual layout adjustments.
Why This Matters for Infrastructure Teams
- Security: Immediate visibility into unintended network paths and exposed services
- Onboarding: New engineers grasp infrastructure relationships in minutes, not weeks
- Compliance: Automated documentation meets audit requirements for network diagrams
- Troubleshooting: Visual dependency mapping accelerates root cause analysis
Unlike proprietary solutions, NetVisor's open-source nature allows customization for complex environments. While initial discovery requires host-level access, its lightweight design (Rust daemon, React-based UI) minimizes overhead. As hybrid infrastructures grow more convoluted, tools like NetVisor transform opaque network sprawl into intelligible, actionable maps—turning documentation from chore into catalyst.
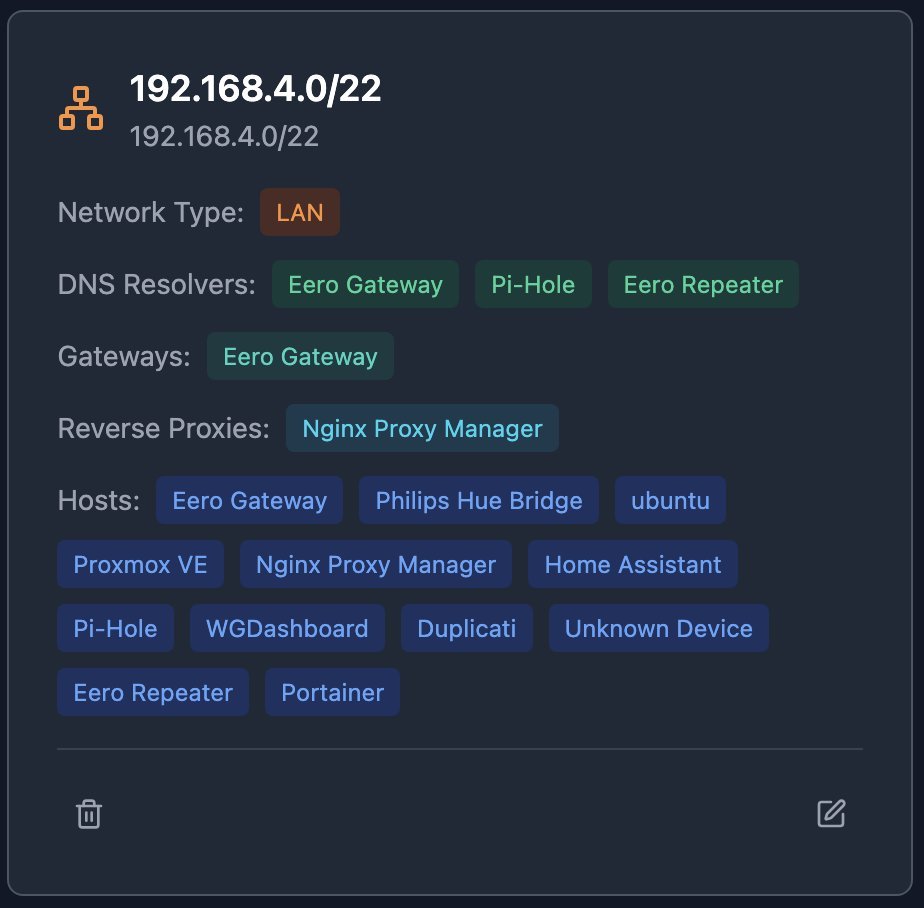 Subnets form the backbone of NetVisor's automated network organization.
Comments
Please log in or register to join the discussion