Microsoft’s new Azure Copilot Observability Agent brings LLM‑driven, chat‑based root‑cause analysis to Azure Monitor. The article compares its capabilities, pricing model, and migration considerations against AWS DevOps Guru and Google Cloud Operations, and outlines the business impact for organizations adopting hybrid cloud observability.
Azure Copilot Observability Agent Enters Public Preview
Modern cloud workloads emit a flood of telemetry—metrics, logs, traces, alerts, and platform signals. Turning that raw data into actionable insight still requires a deep understanding of the application stack and the tools that collect the signals. Microsoft’s Azure Copilot Observability Agent (ACA) is designed to act as a conversational companion throughout the observability lifecycle, from onboarding to root‑cause analysis.
What changed?
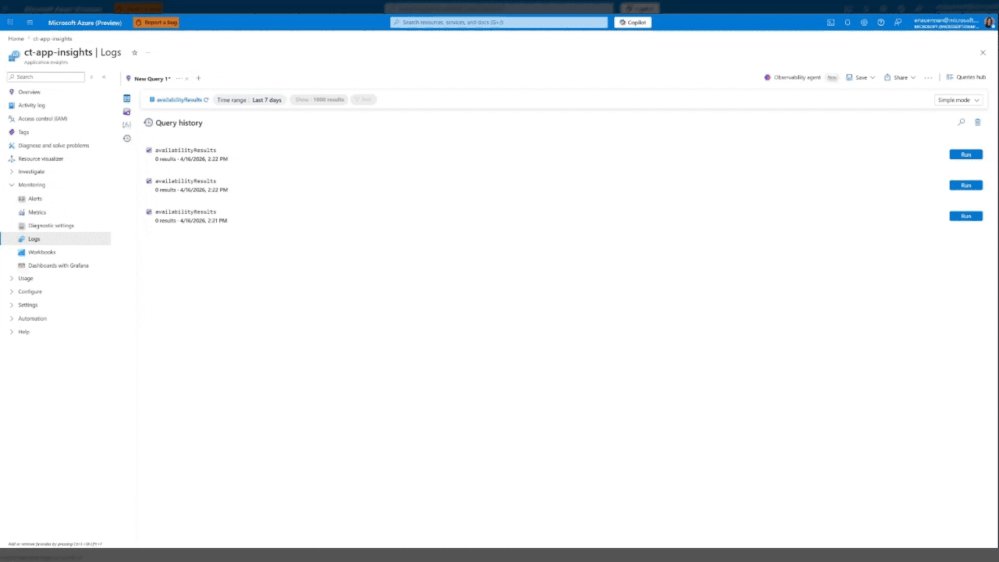
- Chat‑driven investigations – Users can start a deep dive directly from an Azure Monitor alert or from the Logs blade by typing natural‑language questions.
- LLM‑backed reasoning – ACA combines large language models with Microsoft‑built ML to correlate anomalies across application, infrastructure, and Azure platform layers.
- Investigation reports – The agent generates a structured report that includes the reasoning chain, queries executed, and suggested remediation steps. The report can be saved as an Azure Monitor Issue for team collaboration.
- Ad‑hoc analytics – Even without an alert, operators can ask the agent to surface trends, correlations, or to explain existing Kusto queries.
- Roadmap toward autonomy – Future updates will enable proactive incident detection, automatic issue creation, and tighter integration with external ticketing systems.
Provider comparison
| Feature | Azure Copilot Observability Agent | AWS DevOps Guru | Google Cloud Operations (formerly Stackdriver) |
|---|---|---|---|
| Interaction model | Natural‑language chat inside Azure Monitor portal; can be invoked from alerts, Logs blade, Activity Log | Primarily UI‑driven insights with limited conversational UI (Amazon Q for Business is separate) | UI dashboards and AI‑driven insights via Cloud Monitoring; no built‑in chat interface |
| Underlying AI | Azure OpenAI Service (GPT‑4‑turbo) + custom ML models for anomaly detection | Amazon Lookout for Metrics + custom ML; no LLM integration yet | Vertex AI models for anomaly detection; no LLM for conversational queries |
| Scope of signals | Azure Monitor metrics, logs, traces, Azure Activity Log, platform signals (AKS, VMs, Azure Functions) | CloudWatch metrics, logs, events; limited to AWS services | Cloud Monitoring metrics, logs, traces; integrates with GKE, Compute Engine, Cloud Run |
| Investigation report | Structured markdown with chain‑of‑thought, queries, and recommended actions; saved as Azure Monitor Issue | Recommendations are presented as suggestions; no persistent issue object | Recommendations appear as insights; no built‑in issue persistence |
| Pricing model (preview) | Free for up to 1 M observability events per month; beyond that $0.0002 per event processed. No separate charge for chat usage. | Free tier includes 10 GB of logs and 1 M metrics per month; DevOps Guru charges $0.10 per GB of analyzed data. | Free tier: 150 GB logs, 1 M metric time series; beyond that $0.01 per GB logs, $0.01 per metric time series. No LLM charge yet. |
| Migration considerations | Works natively with existing Azure Monitor resources; minimal schema changes. Export of logs/metrics to other clouds via Azure Event Hubs or Azure Monitor Export. | Requires enabling DevOps Guru on each AWS account; data must be in CloudWatch. Export to third‑party tools via Kinesis Firehose. | Requires moving metrics/logs to Cloud Monitoring; can ingest via OpenTelemetry. Export to external SIEMs via Pub/Sub. |
Pricing perspective
ACA’s preview pricing is deliberately low‑cost to encourage experimentation. The per‑event charge is comparable to the incremental cost of CloudWatch logs ingestion on AWS, but ACA bundles the LLM interaction at no extra fee. For organizations already heavily invested in Azure Monitor, the marginal cost of adding ACA is essentially the cost of the underlying telemetry ingestion, which many already pay for.
In contrast, AWS DevOps Guru adds a separate per‑GB analysis fee, which can double the cost of a high‑volume CloudWatch deployment. Google Cloud’s pricing remains competitive for raw logs, but the lack of a conversational layer means additional tooling (e.g., Dialogflow) would be required, adding hidden costs.
Business impact and migration strategy
Reducing mean‑time‑to‑resolution (MTTR)
The chat interface lets on‑call engineers ask "Why did latency spike at 02:13 UTC?" and receive a concise root‑cause hypothesis within seconds. By surfacing the reasoning chain, the agent also serves as a knowledge‑transfer tool for junior staff, accelerating onboarding.
Consolidating tooling
Many enterprises run separate APM, log analytics, and alerting platforms. ACA’s ability to ingest signals from AKS, VMs, and Azure Functions means a single pane of glass can replace a fragmented stack, reducing license overhead and simplifying governance.
Migration checklist for Azure‑centric customers
- Enable Azure Monitor – Ensure all workloads publish metrics, logs, and traces to Azure Monitor. Use Azure Monitor export to forward data to Event Hubs if you need downstream replication.
- Activate the Observability Agent – From the Azure portal, navigate to Azure Monitor → Observability Agent and opt‑in to the public preview.
- Define alert integration – Update existing alert rules to include the "Run Observability Agent" action. This allows automatic deep investigations when thresholds breach.
- Export to external systems – If you use ServiceNow or Jira, configure Azure Logic Apps to listen for Azure Monitor Issue creation events and create corresponding tickets.
- Pilot and measure – Run a pilot on a non‑critical AKS cluster. Track MTTR before and after ACA adoption; Microsoft’s preview documentation suggests a 30‑40 % reduction in average resolution time.
Migration for multi‑cloud environments
Enterprises that operate across Azure, AWS, and GCP can adopt a best‑of‑both approach:
- Keep ACA for Azure workloads where it offers native integration.
- Deploy AWS DevOps Guru for AWS resources, but route alerts to a central incident platform (e.g., PagerDuty) that also receives ACA‑generated Azure Monitor Issues.
- Use Google Cloud Operations for GCP workloads, and feed its insights into the same incident platform.
A unifying layer such as Microsoft Sentinel or an open‑source observability hub (e.g., Grafana Cloud) can ingest the normalized alerts from each provider, giving leadership a single view of incident health across clouds.
Looking ahead
Microsoft’s roadmap signals deeper integration with Azure Monitor experiences, more entry points (e.g., Azure Pipelines, Azure DevOps), and autonomous observability where the agent can proactively launch investigations and create issues without human prompting. The ability to push investigation context into external ticketing or CI/CD pipelines will close the loop between detection and remediation.
For organizations evaluating a shift toward AI‑augmented observability, the Azure Copilot Observability Agent offers a compelling blend of native Azure telemetry, LLM‑driven reasoning, and a low‑cost preview that can be tested without major architectural changes.
Next steps
- Register for the public preview via the Azure portal.
- Follow the official documentation for setup details.
- Join the live webinar (link in the original blog) to see real‑world scenarios.
- Provide feedback through the Give Feedback button or email [email protected].
Comments
Please log in or register to join the discussion