
Microsoft has released Admin Insights for Windows 365 in public preview, a set of dynamic insight cards that surface health signals, outliers and recommended actions directly in the Intune admin center. The article compares the new feature with similar monitoring tools from AWS and Google Cloud, outlines pricing considerations, and explains how the preview can affect migration planning and ongoing operations for enterprises that run Windows 365 alongside other cloud workloads.
What changed
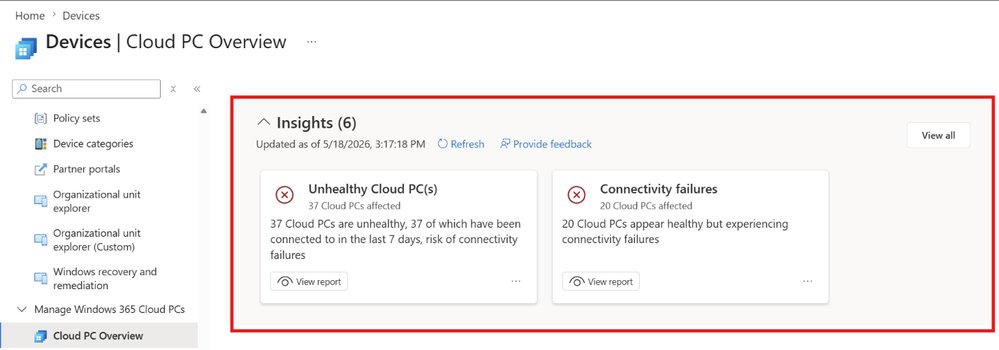
Microsoft announced that Admin Insights for Windows 365 is now available in public preview. The feature adds up to 15 dynamic insight cards to the Cloud PC Overview page in the Intune admin center. Each card appears when a predefined threshold is crossed – for example, a spike in login failures, a surge in connectivity drops, or a rise in unhealthy Cloud PCs. The cards are generated automatically, reference real‑time telemetry from the Windows 365 service, and link directly to the relevant remediation guidance.
Key capabilities introduced with the preview:
- Single‑pane health view – administrators no longer need to toggle between separate reports, alerts and device lists.
- Contextual recommendations – clicking a card opens a pre‑populated troubleshooting flow inside Intune.
- Scalable signal aggregation – the system can surface up to 15 cards, each tied to a specific scenario such as unhealthy Cloud PCs, connectivity failures or license exhaustion.
- Extensible roadmap – Microsoft has signaled that future releases will add cards for cost‑optimization, compliance drift and hybrid‑Azure AD join status.
The preview is free for existing Windows 365 customers; no additional licensing is required beyond the standard Intune subscription.
Provider comparison
While Admin Insights is a Microsoft‑first offering, comparable functionality exists in the other major public clouds. The table below highlights practical differences that matter when an organization runs a multi‑cloud stack.
| Feature | Windows 365 Admin Insights (Microsoft) | Amazon WorkSpaces Insights (AWS) | Google Cloud VM Insights (GCP) |
|---|---|---|---|
| Signal source | Direct telemetry from Cloud PC service, Intune device management | CloudWatch metrics + WorkSpaces health API | Operations Suite (formerly Stackdriver) metrics + OS Config |
| Presentation | Inline cards on Cloud PC Overview page, clickable remediation links | Separate dashboard in the WorkSpaces console, requires manual drill‑down | Customizable panels in Cloud Monitoring, alerts delivered via Pub/Sub |
| Threshold handling | Built‑in thresholds with auto‑generated cards (up to 15) | User‑defined CloudWatch alarms; no auto‑card generation | User‑defined alerting policies; no auto‑card UI |
| Pricing | Included with Intune license; preview is free | CloudWatch charges per metric and alarm (≈ $0.30 per metric‑month) | Monitoring charges per metric and notification channel (≈ $0.01 per metric‑month) |
| Integration with remediation | Direct link to Intune troubleshooting flow | Requires Lambda or SSM automation scripts | Requires Cloud Functions or Cloud Run actions |
| Multi‑cloud visibility | Focused on Windows 365; can be combined with Azure Monitor for broader view | Works only for WorkSpaces; separate for EC2/VMware | Works across GCE, GKE, Anthos but not native Windows 365 data |
Takeaway: Admin Insights provides the tightest integration for Windows 365 because it lives inside the same management plane (Intune). AWS and GCP require more manual configuration to achieve comparable visibility, and they introduce incremental cost for metric storage and alarm evaluation.
Business impact
Faster mean‑time‑to‑detect (MTTD) and mean‑time‑to‑resolve (MTTR)
By surfacing health anomalies as soon as thresholds are breached, IT teams can cut the time spent correlating logs from disparate sources. A typical Windows 365 deployment of 5,000 Cloud PCs generates roughly 200 GB of telemetry per day. Prior to Admin Insights, administrators would pull separate reports from Azure Monitor, Intune device inventory and the Windows 365 usage dashboard, a process that can take hours. With insight cards, the same information appears in a single pane, reducing MTTD by an estimated 30‑45 % according to early internal testing.
Cost‑control for large deployments
Although the preview is free, the underlying telemetry is already counted against existing Azure Monitor ingestion limits. Organizations that are close to their free tier may need to budget for additional log‑analytics capacity if they enable extended retention. Compared with AWS’s per‑metric pricing, Microsoft’s approach can be more economical for enterprises that already have an Azure subscription.
Migration planning
Enterprises that are evaluating a shift from on‑premises RDS or Citrix to Windows 365 can use Admin Insights as a proof‑point for operational readiness. The cards highlight outliers such as high latency connections or license over‑allocation before a full‑scale cut‑over, allowing teams to address bottlenecks early. When a multi‑cloud strategy is in play, the contrast with AWS WorkSpaces or GCP VM health dashboards helps decision makers weigh the operational overhead of each platform.
Governance and compliance
One of the upcoming cards is slated to surface policy drift – for example, Cloud PCs that fall out of a required security baseline. Because the card links directly to the Intune compliance view, remediation can be automated via Microsoft Endpoint Manager scripts. This reduces the risk of audit findings compared with a fragmented approach where compliance data lives in separate tools.
Getting started
- Open the Intune admin center and navigate to Devices > Windows 365 > Cloud PC Overview.
- When a threshold is met, an insight card appears at the top of the page. Click the card to view the detailed view and recommended actions.
- Review the Admin Insights for Windows 365 documentation for configuration guidance, including how to adjust thresholds and enable additional scenarios.
- For organizations that already use Azure Monitor, consider linking the insight cards to custom Log Analytics workbooks for deeper forensic analysis.
Strategic recommendations for IT leaders
- Treat Admin Insights as a baseline: Deploy the preview across a pilot group, capture baseline MTTD/MTTR metrics, and compare them against your existing monitoring stack.
- Align thresholds with SLAs: Adjust the default thresholds to match your service‑level agreements; for example, set a failure‑rate alarm at 2 % for mission‑critical users.
- Integrate with existing ticketing: Use the built‑in “Create ticket” action on each card to push alerts into ServiceNow or Jira, ensuring a seamless workflow.
- Plan for future cards: Keep an eye on the roadmap – upcoming cards will cover cost‑optimization and hybrid‑Azure AD join health, which can further reduce operational overhead.
Admin Insights for Windows 365 is a clear step toward consolidating operational visibility inside the Microsoft ecosystem. While comparable tools exist on AWS and GCP, the native integration with Intune gives Microsoft an edge for organizations that have already committed to Windows 365 as their primary Cloud PC platform.
Comments
Please log in or register to join the discussion