Microsoft has moved OpenTelemetry Guest OS metrics for Azure VMs and Arc-enabled Servers to general availability, swapping proprietary Log Analytics collection for a standards-based pipeline that promises lower costs, native PromQL, and consistent telemetry across Windows and Linux. For teams running workloads across more than one cloud, this is less about a single feature and more about whether your monitoring tooling stays locked to a vendor or moves toward portability.
At Build 2026, Microsoft announced the general availability of OpenTelemetry (OTel) Guest OS metrics for Azure VMs and Arc-enabled Servers. On the surface this reads as one more incremental Azure Monitor update. Look closer and it signals a deliberate shift in how Microsoft wants you to instrument infrastructure: away from proprietary, log-pipeline-based collection and toward an open standard that the entire cloud-native ecosystem already speaks.
For anyone weighing a multi-cloud monitoring strategy, that distinction matters more than the feature list. The question is no longer just "can I see CPU and memory on my VMs," but "can I see them the same way regardless of where the VM runs, and without rebuilding dashboards every time I cross a provider boundary."
What changed
OTel Guest OS metrics are collected from inside the virtual machine, not inferred from the hypervisor. The current coverage includes a curated set of CPU, memory, disk I/O, networking, and per-process metrics, things like CPU utilization, memory usage, uptime, and thread count. Because the collection is driven by the upstream OpenTelemetry Host Metrics Receiver, the supported set is point-in-time and expands as the open-source project evolves rather than on Microsoft's internal release cadence.
That last point is the strategic shift. Previously, Azure customers leaned on Log Analytics (LA) based metrics for fleet visibility. That path still works, remains generally available, and is trusted by thousands of customers. But it is an Azure-specific collection model. The new OTel pipeline stores data in Azure Monitor Workspace using metric-optimized storage, exposes it through native PromQL, and emits the same metric names whether the guest is Windows or Linux.
Alongside the GA, Microsoft shipped several capabilities built on top of this foundation:
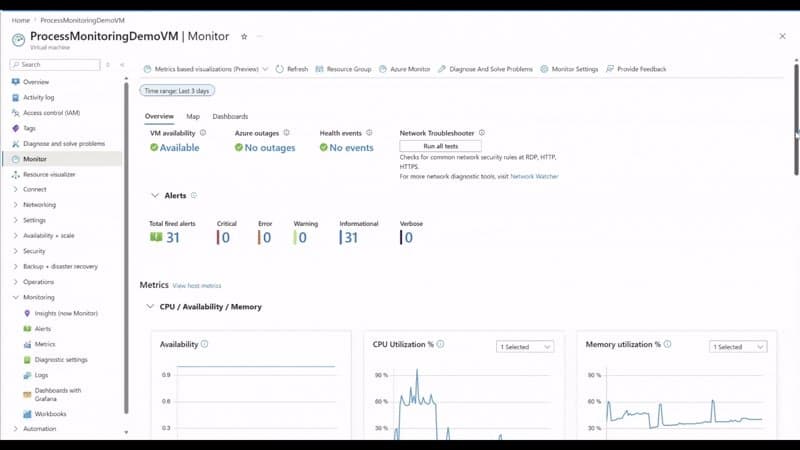
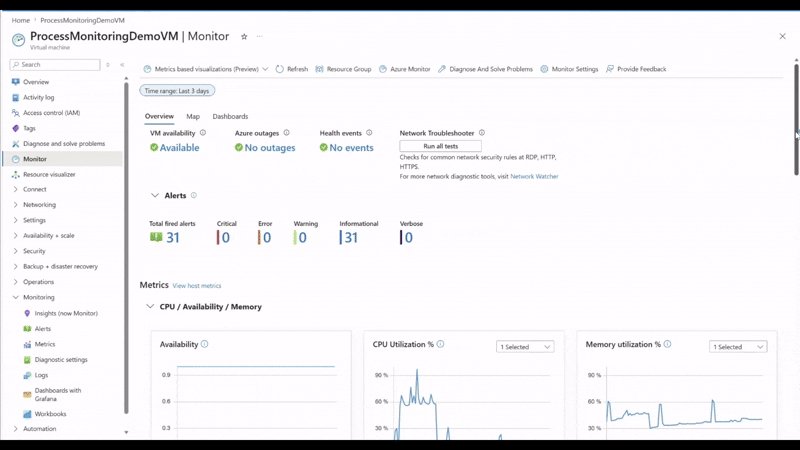
- An enhanced VM monitoring experience with a Basic view (host-OS metrics, no configuration, available on every Azure VM) and a Detailed view (guest-OS metrics, requires light onboarding) in a single interface.
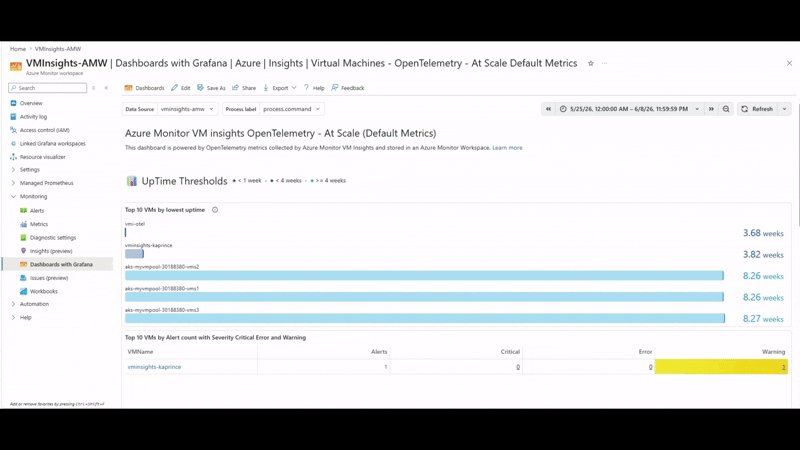
- Out-of-the-box Grafana dashboards for at-scale, host-level, guest-OS, and per-process monitoring, with full customization and community dashboard imports.
- Resource-scope querying for Azure Monitor Workspace metrics, so you can query from the context of a resource, resource group, or subscription without knowing which workspace physically stores the data.
- A preview-bound extension of the Azure Copilot Observability Agent that will fold guest-OS and per-process signals into guided troubleshooting narratives.
Provider comparison: where this sits in the market
To understand why Microsoft is doing this, it helps to look at how the three major clouds approach VM-level telemetry, because the contrast is exactly what a multi-cloud team is trying to reconcile.
Azure (before this GA). Guest metrics flowed through the Log Analytics agent and later the Azure Monitor Agent into a Log Analytics workspace. Powerful for correlation and KQL-based analytics, but the query language, the storage model, and the metric schema were all Azure-native. Moving those dashboards or alert definitions to another platform meant rebuilding them.
AWS. CloudWatch collects basic EC2 metrics at the hypervisor level for free, with deeper guest metrics requiring the CloudWatch agent. AWS has been adding OTel support through the AWS Distro for OpenTelemetry, but the default path still funnels into CloudWatch's own metric and query model.
Google Cloud. The Ops Agent is itself built on OpenTelemetry and Fluent Bit, making GCP arguably the furthest along in treating OTel as the native collection layer rather than a bolt-on.
Seen against that backdrop, Azure's GA is a catch-up-and-leapfrog move. By making OTel guest metrics a first-class, default-cost option with native PromQL and managed Grafana, Microsoft is positioning Azure Monitor as a backend that does not require you to abandon the open tooling your platform team already runs. The metrics can flow into Azure Monitor, into an existing OTel collector pipeline, or into another compatible observability backend such as a self-hosted Prometheus or a third-party SaaS like Grafana Cloud or Datadog.
Pricing and the cost calculus
The cost story is where this gets concrete for budget owners. Default OTel Guest OS metrics are available at no additional charge and are stored in Azure Monitor Workspace with metric-optimized storage and pricing. Microsoft is explicit that this delivers lower cost and faster query performance than LA-based metrics, which are billed against Log Analytics ingestion and retention.
That difference compounds at fleet scale. Log Analytics pricing is driven heavily by ingested data volume, and high-cardinality guest metrics across thousands of VMs add up. A metric-optimized time-series store is purpose-built for exactly this shape of data, so teams running large estates should model the delta carefully. Per-process metrics, the optional deeper tier, are where you trade some additional collection for the ability to spot noisy processes, memory leaks, runaway jobs, and resource-intensive applications without signing into individual machines.
A reasonable migration posture is to keep LA-based metrics where you genuinely need their advanced analytics and cross-signal correlation, and move routine health, alerting, and dashboarding workloads to the OTel path to capture the cost and performance gains. This is not an either-or decision forced on you; both run side by side, and Microsoft is positioning OTel as the default for new monitoring rather than a forced cutover.
Migration considerations
If you decide to adopt the OTel path, the onboarding mechanics are designed for scale rather than per-VM clicking. There are four practical entry points worth knowing before you plan a rollout:
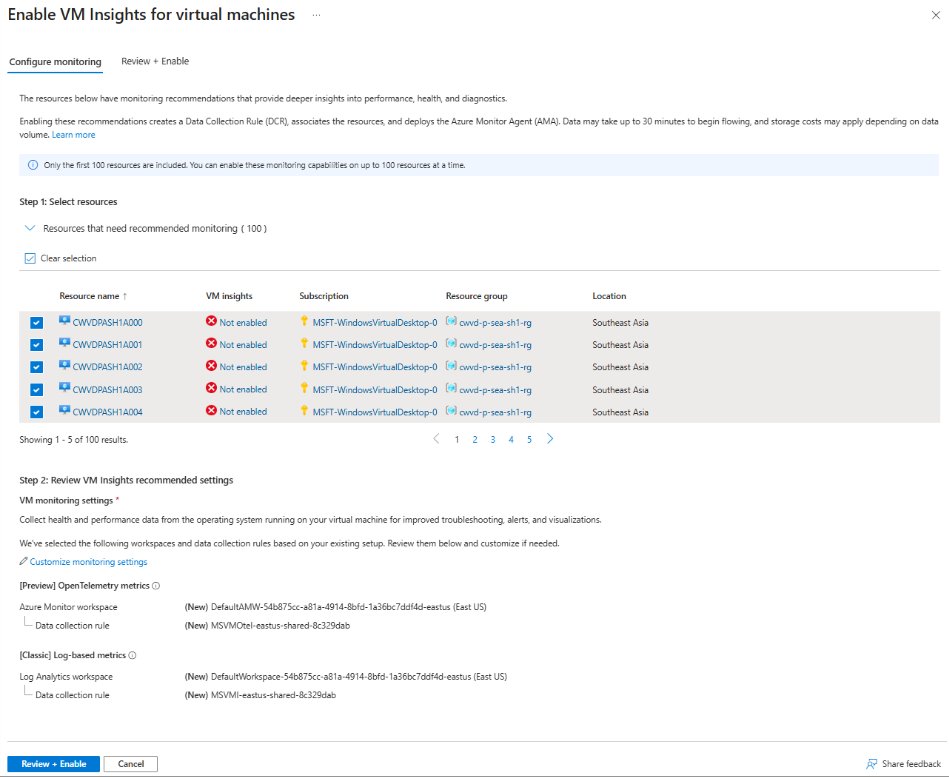
- Monitoring Coverage experience in the Azure portal, which reviews recommended resources and walks VMs through a guided onboarding workflow. This is the fastest start for most teams.
- ARM and Bicep templates, for teams that treat monitoring configuration as infrastructure-as-code and want the same setup applied programmatically and reproducibly across environments.
- Azure Advisor recommendations, which proactively flag VMs that are not fully monitored and enable OTel-based collection in a few clicks, so coverage improves without manual auditing.
- Reusing an existing Data Collection Rule (DCR) during onboarding, then evolving that single DCR to collect additional metrics and logs, with changes propagating to every associated VM.
That DCR reuse point is the one to design around. Centralizing collection logic in a shared DCR means your fleet's monitoring definition lives in one governed object instead of being scattered across thousands of VM configurations. For a platform team standardizing observability across business units, that is the difference between a maintainable rollout and configuration drift.
Microsoft has published direct guidance for the transition, including how to migrate from logs-based to OpenTelemetry metrics and how to enable enhanced monitoring for a VM. Arc-enabled Servers are included throughout, which is the detail that makes this relevant beyond pure Azure shops: the same collection model applies to on-premises and other-cloud machines projected into Azure through Azure Arc.
The Copilot angle
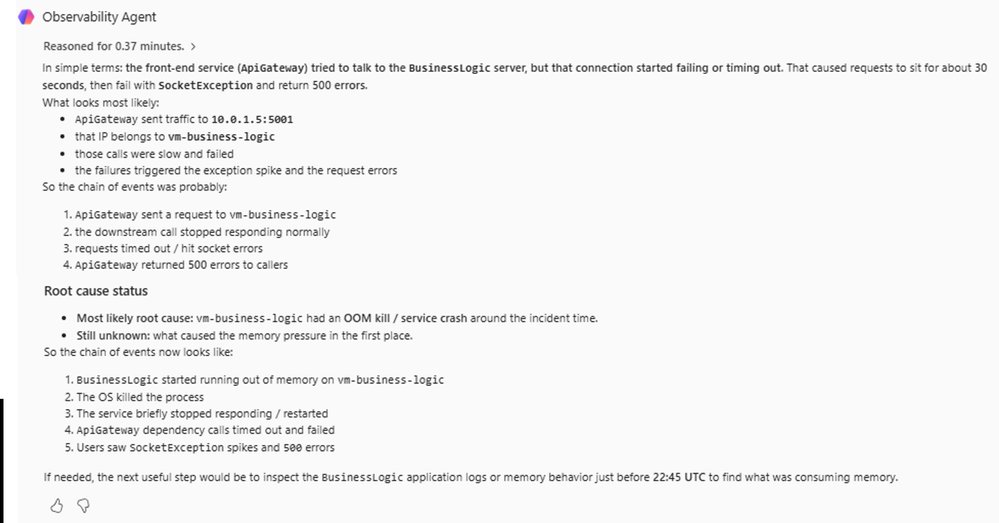
The forthcoming Observability Agent troubleshooting capability, arriving in public preview, is worth flagging for where it points. Today the agent correlates application and infrastructure signals, LA-based metrics, logs, alerts, health data, and recent changes into a guided investigation. Adding OTel guest-OS and per-process metrics gives it finer-grained operating-system insight, so instead of stitching signals across tools and timelines by hand, an engineer receives a summary with likely causes and recommended next steps.
The strategic read here is that Microsoft is building its AI-assisted troubleshooting on the same open metric foundation as its manual tooling. If both the human-driven Grafana dashboards and the machine-driven investigation agent consume identical OTel metrics, the data layer becomes the durable asset and the experiences on top of it become interchangeable.
Business impact
For a single-cloud Azure shop, the takeaway is straightforward: there is now a cheaper, faster, more consistent way to monitor VMs, and the migration tooling is good enough to justify evaluating it this quarter rather than next year.
For a multi-cloud organization, the implications run deeper. Standardizing on OpenTelemetry at the collection layer means your monitoring investment, the dashboards, the alert logic, the queries, becomes portable in a way it was not when each provider locked you into its own agent and query language. You can point OTel guest metrics from Azure VMs, Arc-enabled on-prem servers, and OTel-instrumented workloads on other clouds into a common backend, whether that is Azure Monitor, a managed Grafana stack, or a vendor-neutral store. The metric names and PromQL queries travel with you.
That portability is the real product here, and it cuts against the historical instinct of every cloud provider to make observability a retention mechanism. Microsoft is calculating that being the most open and lowest-friction place to run OpenTelemetry wins more workloads than locking customers into proprietary metrics would. For teams architecting their observability strategy now, the prudent move is to treat OpenTelemetry as the default collection standard across your estate and to evaluate each provider on how cleanly it lets that data in and out, rather than on the polish of its proprietary dashboards. Azure just made a credible case for itself on exactly that axis.
Comments
Please log in or register to join the discussion