
System changes are the dominant driver of production incidents, making change-related metrics critical reliability signals. This article explores a comprehensive metrics framework combining business-level indicators with technical controls, plus an event-centric architecture for scalable change observability.
Change as Metrics: Measuring System Reliability Through Change Delivery Signals
System changes are the single biggest cause of production incidents. Industry studies and real-world postmortems commonly attribute sixty to eighty percent of incidents to some form of change to code, configuration, data, or experiments. Despite this, many organizations treat change observability as an afterthought rather than a core component of reliability engineering.
This article proposes a metrics framework that treats change-related metrics as first-class reliability signals. By measuring both efficiency and reliability of the change delivery process, teams can reduce incident risk while maintaining delivery velocity. We'll explore business-level indicators, technical control metrics, and an event-centric architecture that makes these measurements scalable across heterogeneous systems.
The Critical Nature of Change Observability
The observability of changes is as important as other reliability signals, such as success rate, queries per second (QPS), and latency. This idea aligns closely with industry-standard software delivery performance frameworks like the DORA metrics, which define four key indicators of software delivery performance:
- Deployment frequency
- Lead time for changes
- Change failure rate
- Time to restore service
Teams that perform strongly on DORA metrics have a positive correlation with higher system stability, faster recovery, and better business outcomes. However, these metrics need adaptation for large-scale, multi-platform change governance. In practice, higher deployment frequency doesn't inherently indicate better performance—multiple code changes may be intentionally batched into a single deployment to reduce operational risk. Similarly, time to restore service primarily characterizes incident response effectiveness rather than change quality.
Characteristics of System Changes
To design an effective metrics framework, we must first understand the fundamental characteristics of system changes, as these properties directly shape risk, observability requirements, and operational behavior:
Heterogeneous
Different types of changes often follow different workflows, validation steps, and risk-control mechanisms. Code changes typically pass through unit testing, integration testing, regression testing, and progressive rollout before full production deployment. Configuration changes may require stronger approval governance, auditability, and change-review checkpoints, as they can immediately affect live systems without redeployment.
Distributed
Modern systems are built on distributed computing; the change process is likewise distributed in scope, execution, and impact. Changes are often triggered and applied across multiple microservices, data centers, and geographic regions, sometimes by different teams operating on independent release cycles.
High Frequency
With the adoption of CI/CD pipelines, automated deployment platforms, and experimentation systems, changes are introduced to production 24/7 across time zones and engineering teams. This high frequency demands robust measurement systems that can scale without becoming bottlenecks themselves.

Business-Level Metrics Framework
To comprehensively measure the health of the change delivery process, we define the following type-agnostic business-level metrics to evaluate both reliability and efficiency:
Change Lead Time (CLT)
This metric measures the time it takes for a change to be successfully deployed to production. It reflects the efficiency of your delivery process. Shorter lead times indicate faster feedback loops and less friction in the deployment pipeline.
Change Success Rate (CSR)
This metric measures the rate at which a change is successfully deployed to production. A change is considered successful if it completes deployment and does not trigger rollback or immediate revert actions. It reflects both the efficiency and reliability of your delivery process.
Incident Leakage Rate (ILR)
This metric measures the percentage of changes that result in production incidents or post-deployment alerts. Unlike CSR, which focuses on rollback outcomes, ILR captures latent failures, regressions, and operational degradations detected after deployment.
Relationship to DORA Metrics
These metrics are conceptually aligned with DORA's four key indicators but intentionally adapted for large-scale, multi-platform change governance:
- We exclude deployment frequency as a first-class metric because higher frequency doesn't inherently indicate better performance
- We remove time to restore service as it primarily reflects incident response effectiveness rather than change quality
- We retain lead time as a core efficiency metric, adopting CLT as a direct analogue
- Instead of measuring failure rates, we define CSR as its inverse for more intuitive dashboard interpretation
Importantly, CSR alone cannot distinguish between changes that fail during deployment (and are caught early) versus changes that deploy successfully but introduce latent defects. ILR explicitly captures this dimension by measuring post-deployment incident causality.
A healthy system should exhibit:
- Low CLT (fast delivery)
- High CSR (few deployment failures)
- Low ILR (few escaped defects)
Technical-Level Metrics
From these business goals, we derive the following technical-level control metrics to operationalize the change delivery process:
Change Approval Rate
All production changes require approval prior to rollout (e.g., QA validation, risk review, and policy or legal compliance sign-off). This approval serves as the first governance gate to guarantee that changes meet safety, compliance, and quality requirements.
Progressive Rollout Rate
Progressive (or phased) rollout is a widely adopted best practice that allows potential issues to be detected early, before full deployment. Different categories of changes are expected to follow progressive exposure and canary-style rollout to minimize negative impact on live systems.
Change Monitoring Window
The effect of a change may not be immediately observable unless sufficient time is allocated for monitoring during the progressive rollout. In practice, a monitoring window of approximately fifteen to thirty minutes provides a pragmatic balance between operational reliability and delivery efficiency.
Taken together, these metrics form a systematic framework for measuring the health and maturity of the change delivery process, enabling organizations to evaluate and continuously improve both safety and velocity.
Event-Centric Architecture for Change Data
A straightforward approach to collecting change metrics might involve gathering data directly from existing delivery platforms. However, this doesn't scale well due to the heterogeneous and distributed nature of changes in modern systems.
Different delivery platforms often support different types of changes, follow different workflows, and evolve independently over time. Attempting to construct metrics by aggregating data from multiple platform-specific data sources leads to:
- Inconsistent semantics
- Fragmented coverage
- Duplicated logic
- Brittle integrations that require continual maintenance
Event-Driven Architecture
Instead, a scalable and robust solution requires a platform-agnostic, event-driven measurement system that observes change behavior consistently across platforms and regions. This ensures metrics remain comparable, extensible, and resilient to underlying platform evolution.
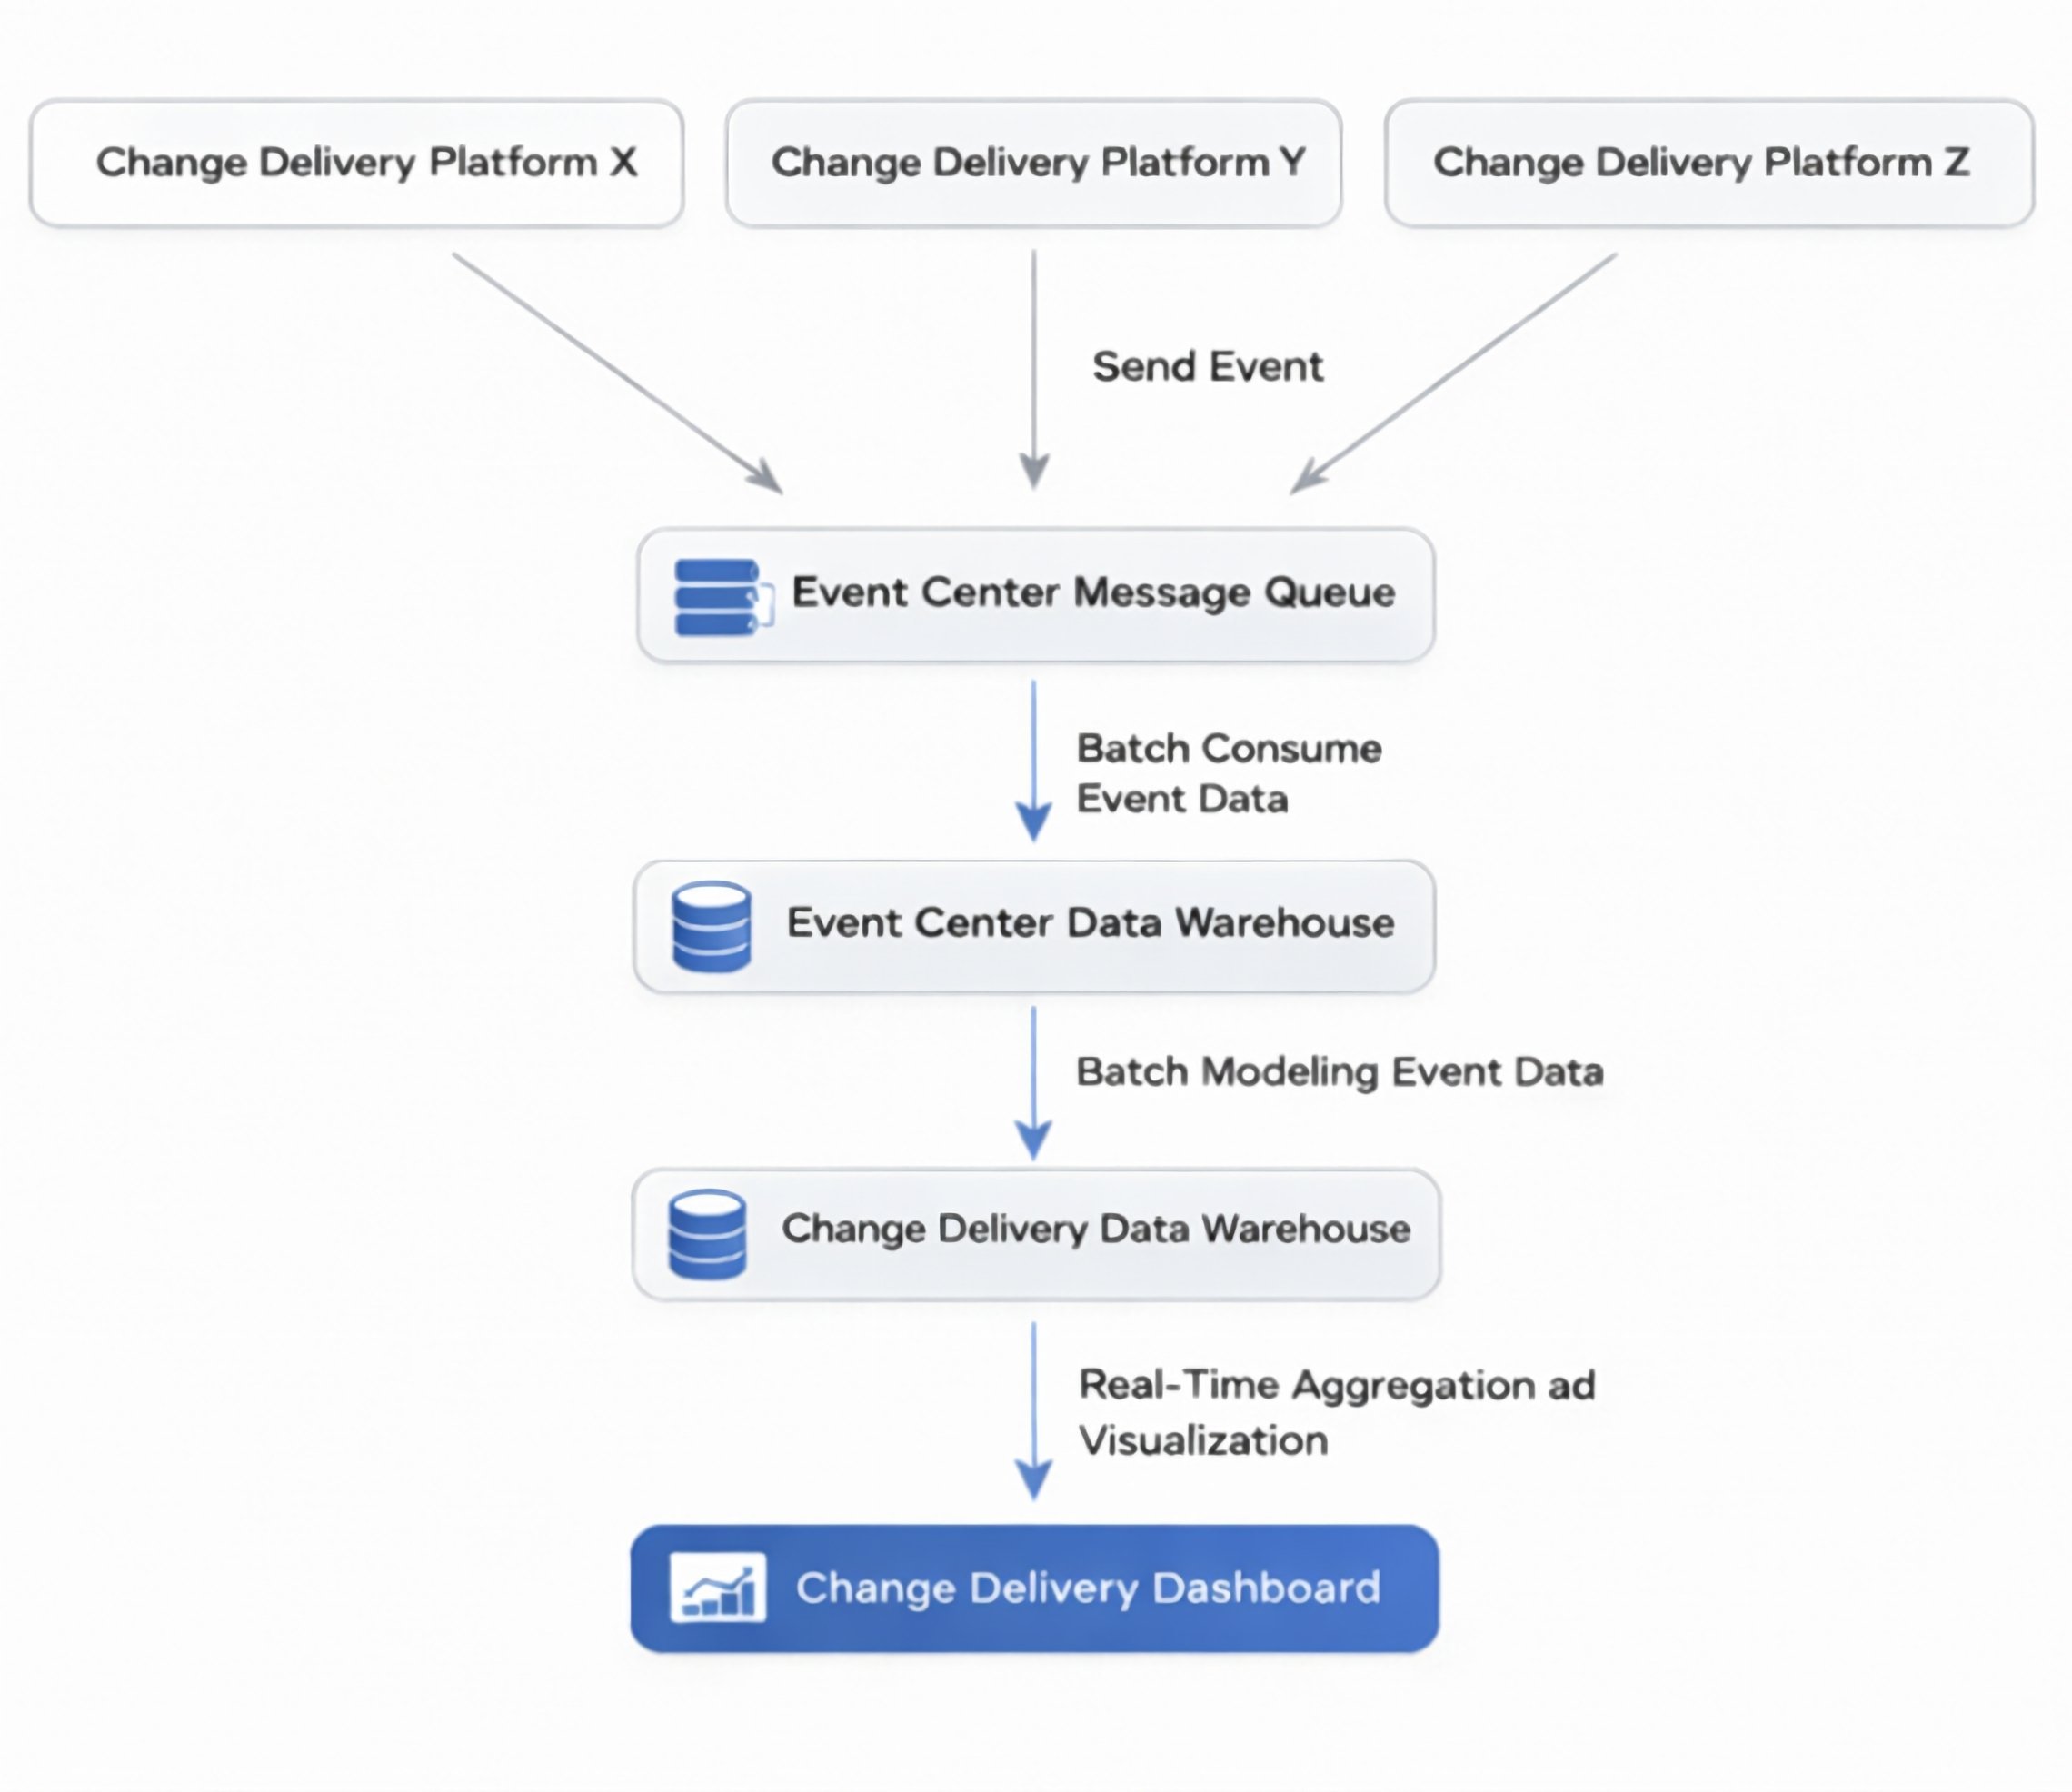
The architecture consists of these key components:
- Event Producers: Change delivery platforms emit structured event messages for each change action
- Centralized Event Queue: A message queue decouples event producers from downstream consumers, providing durability, buffering, and back-pressure protection
- Event Center Data Warehouse: Raw event data is persisted for traceability, historical replay, and audit compliance
- Batch Analytics Pipelines: Transform and enrich data, normalizing schemas, deriving change attributes, correlating cross-platform identifiers, and applying validation logic
- Analytical Warehouse: Stores curated analytical tables for reporting and analysis
- Real-time Aggregation and Visualization Services: Power dashboards and operational insights
This layered approach separates event ingestion, storage, processing, and presentation, providing strong reliability guarantees while supporting both historical analysis and near real-time operational visibility.
The event-centric architecture is also cost-efficient. By centralizing event ingestion and analytics into a shared pipeline rather than duplicating storage and computation across multiple delivery platforms, it eliminates redundant data processing and reduces integration overhead.
While particularly valuable at scale, its benefits extend to smaller organizations experiencing increasing change volume or multiple deployment mechanisms.
Risk-Based Metric Framework
Once the measurement system is in place, organizations can begin tracking change-related metrics to continuously improve system reliability. In practice, change objects should be classified into different criticality tiers based on:
- Business importance
- Blast radius
- Operational risk
Different tiers are then assigned distinct metric targets and reliability expectations (SLOs), rather than applying a single uniform benchmark to all changes.
For example:
- Level-1 (L1): Payment or financial settlement services require stricter objectives such as near-zero change failure rate, higher approval rigor, stronger rollout safeguards, and tighter observability thresholds
- Level-3 (L3): Non-critical or experimental systems (internal tools, analytics dashboards) can tolerate higher change velocity and more flexible reliability targets

This risk-based metric framework aligns reliability goals with business context: high-impact systems are protected with stronger controls, while lower-risk domains retain engineering agility.
Change Management Dashboard Example
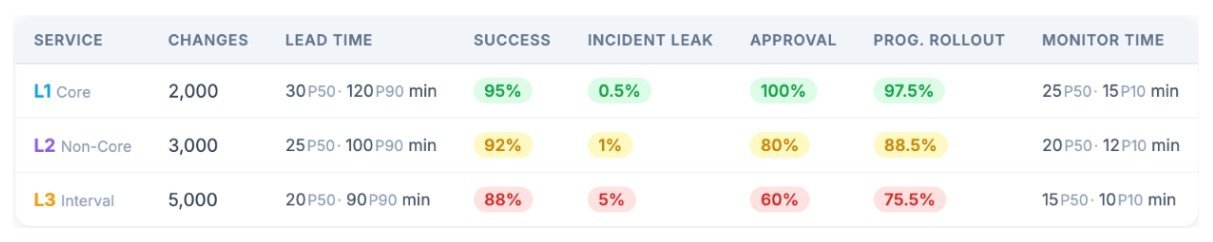
A dashboard based on this metric framework would provide actionable insights like these:
- Reliability perspective: For externally facing services (L1 and L2), the total number of change-induced incidents can be calculated as approximately 2000×0.5%+3000×1%≈40 for the entire year, which is relatively low given the scale of change volume
- Rollout governance effectiveness: High adoption of progressive rollout and reasonable monitoring windows indicate that most changes are protected by staged rollout and observation
- Risk distribution: L1 maintains the highest approval rate and strongest governance controls, showing the lowest incident leakage rate, while L2 processes higher volume with slightly weaker controls
Optimization Opportunities
Even with strong overall performance, metrics can reveal targeted improvements:
- Strengthen monitoring depth for L2 and L3: Higher miss-recall rates suggest some change-induced issues aren't being detected during progressive rollout. Increasing the monitoring window or enhancing automated anomaly detection may help reduce incident leakage
- Tighten governance in high-volume change domains: L3 processes the highest volume of changes with relatively lower approval coverage. Introducing lightweight but systematic governance controls can improve stability without significantly slowing delivery
Implementation Considerations
While this framework is particularly effective in environments with high change volume, distributed ownership, and heterogeneous delivery platforms, it may be unnecessary for smaller systems with:
- Low deployment frequency
- Limited service dependencies
- Minimal operational risk
In such cases, lightweight metrics or platform-native observability may provide sufficient insight without introducing additional architectural complexity.
The model also complements, rather than replaces, established frameworks like DORA metrics, SRE golden signals, and traditional incident-management KPIs. Organizations should adapt the depth of change observability to match system scale, risk profile, and governance needs.
Conclusion
System change is a primary source of production incidents, which means change observability should be treated as a core part of reliability engineering, not as an afterthought. The metrics framework proposed here combines business-level indicators (CLT, CSR, and ILR) with technical-level control metrics (approval, progressive rollout, and monitoring) to help organizations measure both reliability and efficiency of their change delivery process consistently.
The event-centric data architecture provides scalable, platform-agnostic change analytics, while the risk-based, tiered metric model aligns operational safeguards with real business impact. Together, these practices turn change management from a reactive process into a measurable, improvable engineering capability, helping teams reduce incident risk while maintaining delivery velocity.
About the Author:
Peihao Yuan is a Lead Software Engineer and Architect at TikTok. He designs and architects highly available systems, ensuring reliability, observability, and operational excellence across large-scale microservice environments.

Comments
Please log in or register to join the discussion