
A new open-source charting library, ChartGPU, leverages the WebGPU API to render millions of data points in real-time, challenging the performance limits of traditional JavaScript charting libraries that rely on Canvas or SVG.
The JavaScript ecosystem is saturated with charting libraries, from the ubiquitous Chart.js to the more specialized D3.js. Most, however, hit a performance wall when rendering tens or hundreds of thousands of data points, leading to sluggish interactions and dropped frames. ChartGPU, a new open-source library, is betting that the future of high-performance data visualization lies not in Canvas 2D or SVG, but in WebGPU, the next-generation graphics API for the web.
ChartGPU is a TypeScript library built from the ground up to use WebGPU for rendering. Its primary value proposition is performance, specifically for scenarios involving large, dynamic datasets. The library's creators claim it can render 5 million candlestick data points at over 100 frames per second in a live streaming demo, a task that would bring most conventional libraries to a crawl.
How It Works: WebGPU as the Engine
Traditional web charting libraries typically use the HTML5 Canvas 2D API or SVG. Canvas 2D is a raster-based drawing surface, meaning every chart element (line, bar, point) is drawn pixel by pixel. While efficient for static images, redrawing the entire canvas on every interaction or data update becomes computationally expensive with large datasets. SVG, on the other hand, is a vector-based format where each data point is a DOM element. This allows for easy styling and interaction but leads to massive DOM trees that browsers struggle to manage at scale.
WebGPU is different. It's a low-level API that provides direct access to the GPU, similar to DirectX, Vulkan, or Metal. Instead of drawing individual shapes, ChartGPU batches geometry (triangles that form lines, bars, and points) and uploads them to the GPU in bulk. The GPU then handles the heavy lifting of transforming and rendering these batches in parallel. This architecture is fundamentally more efficient for rendering thousands or millions of identical or similar geometric primitives.
The library's architecture centers on ChartGPU.create(...), which manages the canvas and WebGPU lifecycle. It delegates the complex orchestration of layout, scales, data upload, and render passes to a "render coordinator." This separation of concerns allows for optimized rendering pipelines tailored to different chart types. For a deeper look at the internals, the project's API documentation provides detailed notes on the render coordinator's role.
Features and Capabilities
ChartGPU is not just a performance experiment; it aims to be a practical tool for developers. It supports a range of standard chart types:
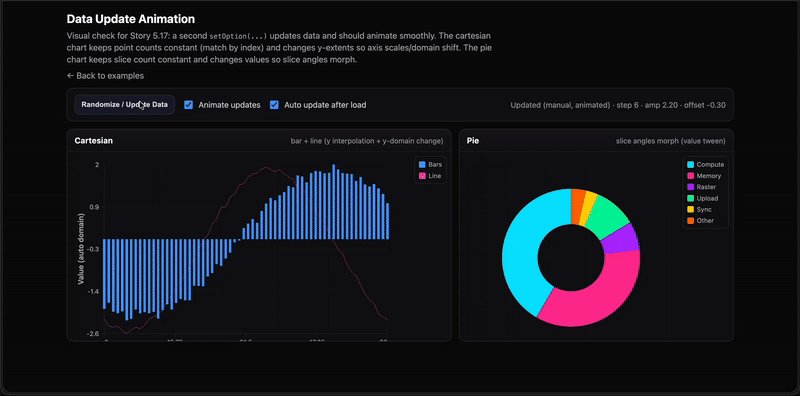
- Cartesian Series: Line, area, bar, and scatter plots.
- Specialized Charts: Pie charts and, notably, financial candlestick charts.
Interaction is a key focus. The library includes built-in support for hover highlights, tooltips, and crosshairs. For navigating dense data, it offers X-axis zooming via both gesture controls and an optional slider UI.
One of its most powerful features for real-time applications is the appendData(...) method. This allows for streaming updates to Cartesian series without re-rendering the entire chart, making it suitable for live data feeds, such as financial tickers or sensor readings.
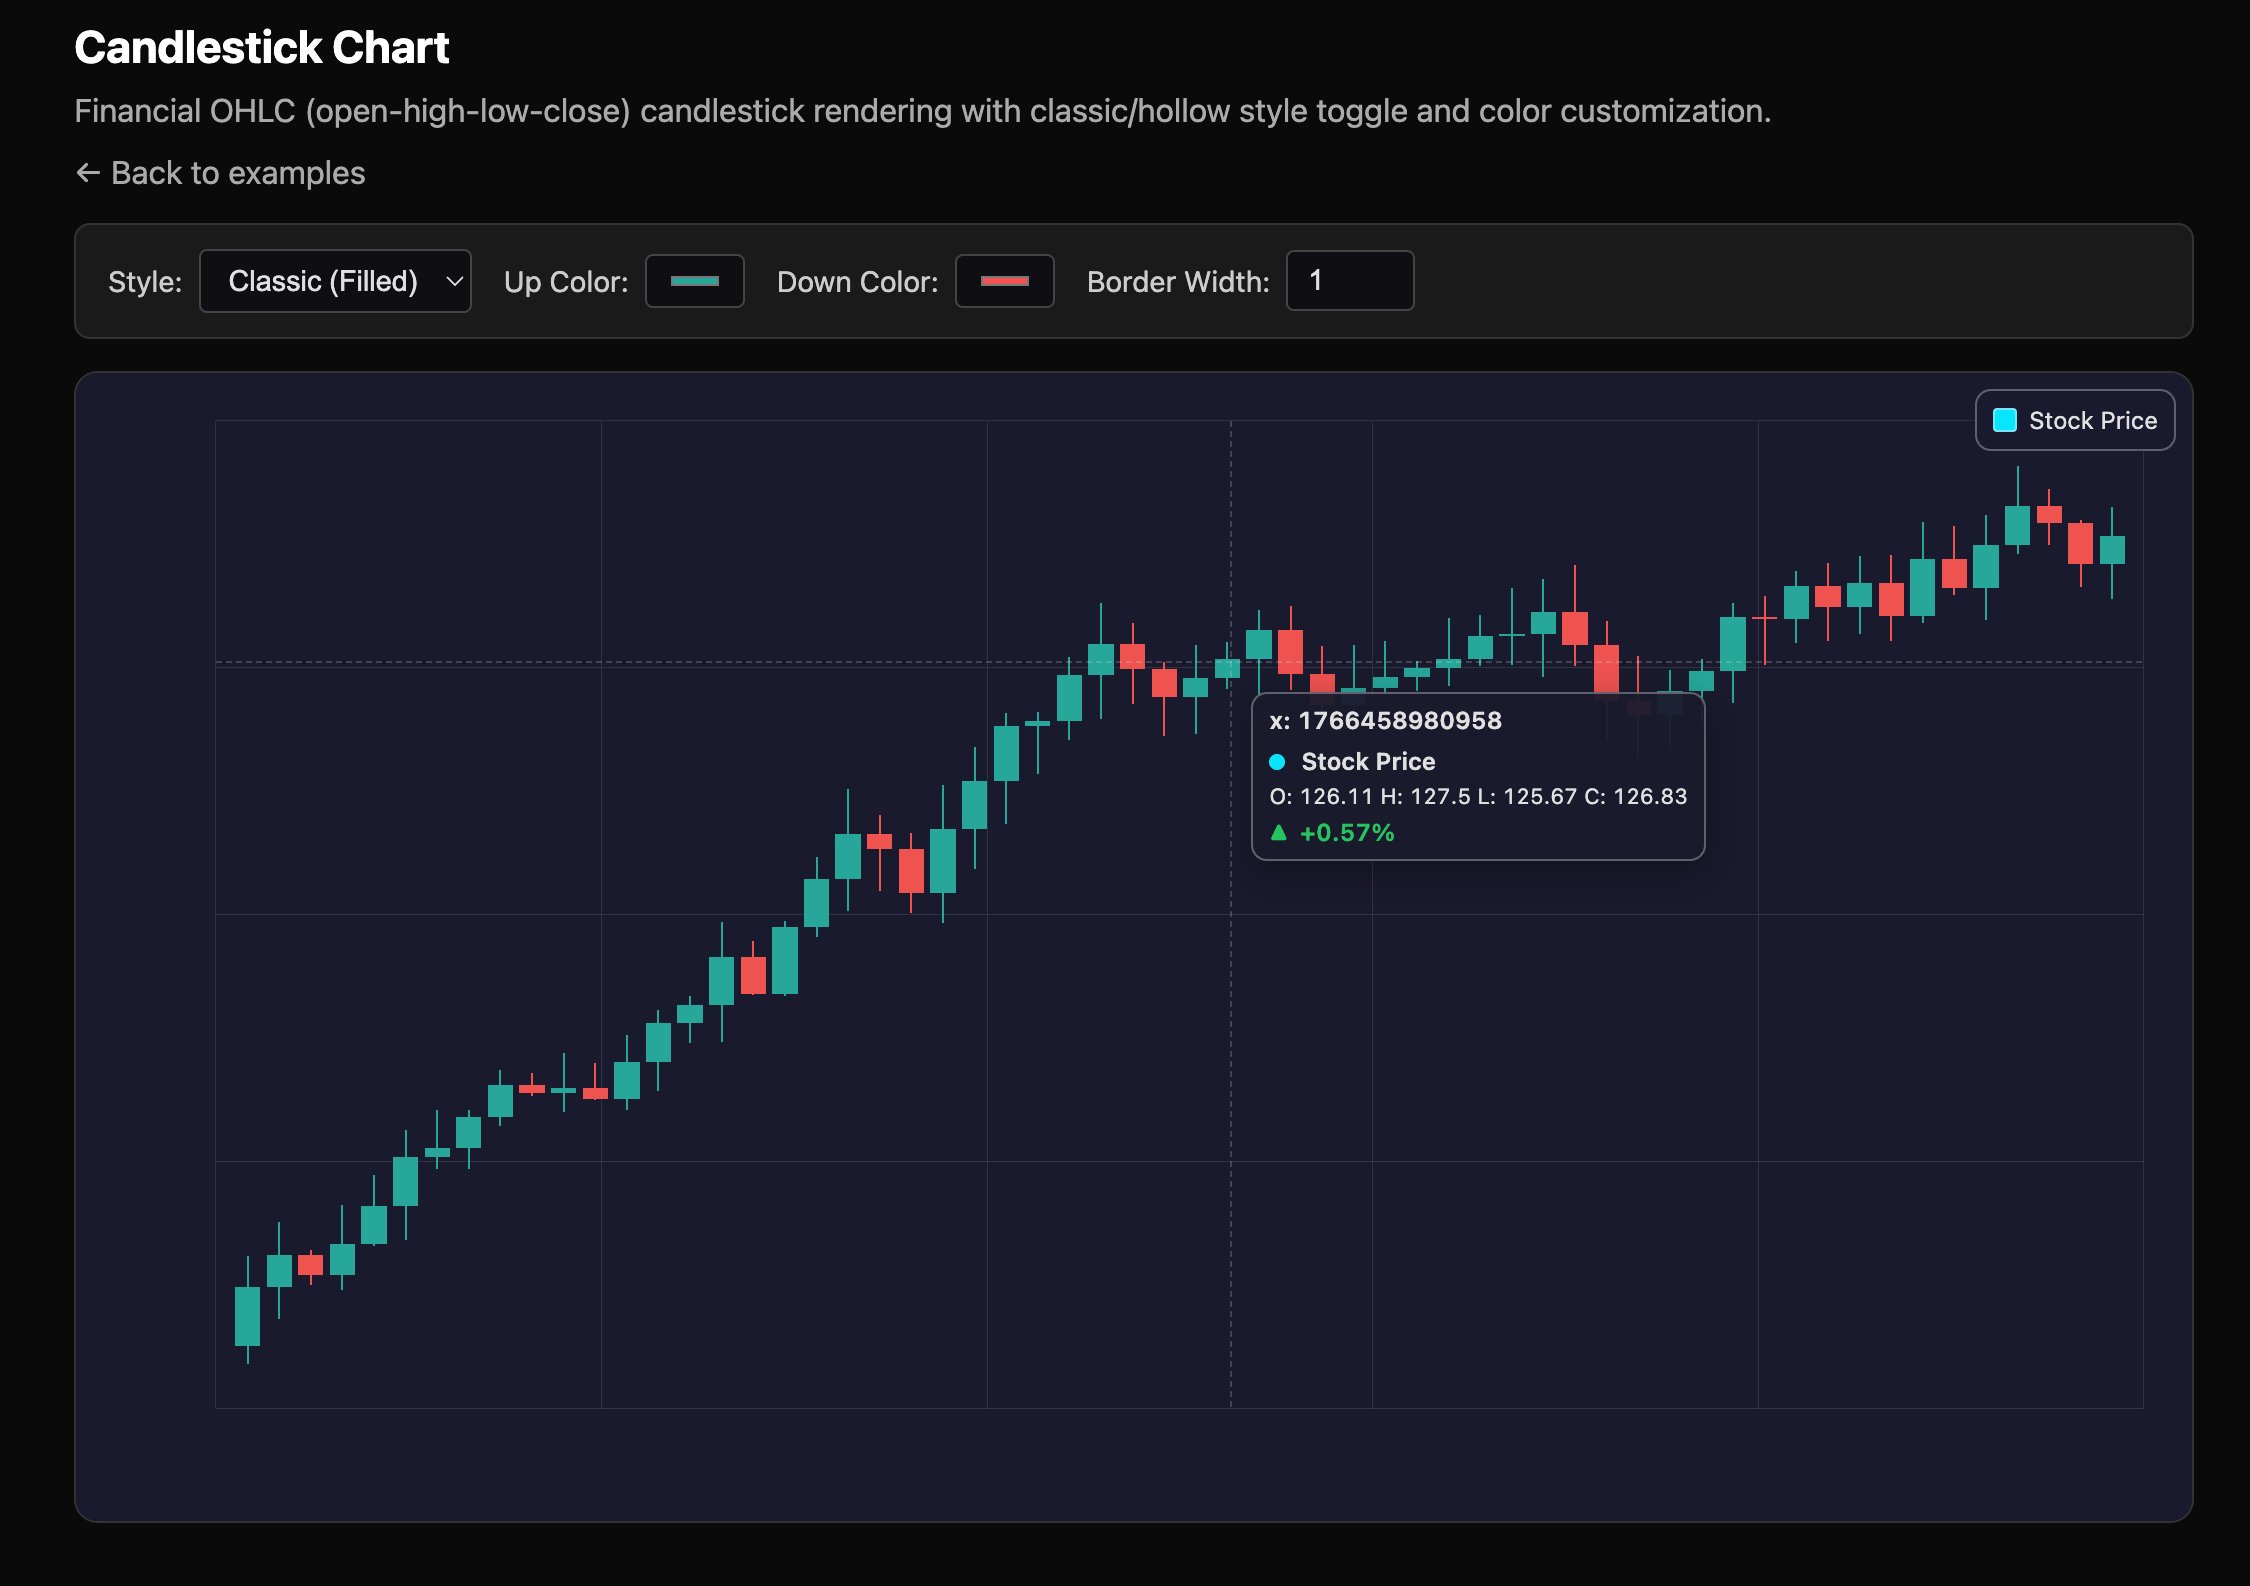
A Financial Use Case: Candlestick Charts
Financial charting is a classic stress test for any visualization library. Candlestick charts, which represent open, high, low, and close (OHLC) data for a given time period, require rendering thousands of individual bars and wicks. ChartGPU demonstrates its capability here with a live streaming demo that renders 5 million candlesticks. The library supports both classic and hollow candlestick styles and allows for color customization, providing the visual flexibility needed for professional trading interfaces.
Practical Considerations: Browser Support and Integration
The primary barrier to adoption for WebGPU-based libraries is browser support. WebGPU is a relatively new standard. ChartGPU requires:
- Chrome 113+ or Edge 113+ (WebGPU is enabled by default).
- Safari 18+ (WebGPU is enabled by default).
- Firefox: Not currently supported, as WebGPU support is still in development.
For developers using modern frameworks, the library offers a dedicated React integration via the chartgpu-react package. This provides a ChartGPUChart component that abstracts the WebGPU lifecycle management, making it easier to embed high-performance charts in React applications.
Getting Started and the Open Source Model
Installation is straightforward via npm: npm install chartgpu. The project provides a Getting Started guide and a set of runnable examples. To explore the examples locally, developers can clone the repository, run npm install, and then npm run dev to launch a local server.
ChartGPU is released under the MIT license, making it free to use in both open-source and commercial projects. The project is actively seeking contributions, with guidelines detailed in its CONTRIBUTING.md file.
The Bigger Picture
ChartGPU represents a growing trend of leveraging WebGPU for computational tasks beyond traditional 3D graphics. As the API becomes more widely supported, we can expect to see more libraries in data visualization, scientific computing, and even machine learning interfaces moving their rendering pipelines to the GPU. For now, ChartGPU offers a compelling, if niche, solution for developers whose charting needs are bottlenecked by the performance of traditional browser rendering technologies.
Comments
Please log in or register to join the discussion