
Elastic open-sources devfiler, a desktop application that packages the core profiling capabilities of its OTel eBPF Profiler, enabling developers to analyze application performance in seconds without deploying a full observability stack. The tool supports macOS and Linux interfaces while requiring a Linux host for actual profiling, significantly lowering the barrier to eBPF-powered performance diagnostics.

Performance profiling just got dramatically simpler. Elastic has open-sourced devfiler, a desktop application that reimplements the entire collection, storage, symbolization, and visualization pipeline of its powerful OpenTelemetry (OTel) eBPF Profiler. This standalone tool slashes setup time from hours to seconds, allowing developers to dive into CPU and memory profiling without spinning up a full Elastic deployment. Released under the Apache-2.0 license, devfiler emerged from an internal Elastic engineer's project aimed at accelerating development workflows and OTLP Profiling prototyping.
Cutting the Observability Overhead
Traditional eBPF profiling often demands complex infrastructure. devfiler eliminates this by packaging the critical components into a single desktop app:
- Instant Profiling: Launch the app, run the eBPF agent pointing to
localhost:11000, and immediately view flame graphs and traces. - Cross-Platform UI: Runs natively on macOS or Linux desktops (though profiling agents still require Linux hosts).
- Simplified Remote Profiling: Use SSH reverse tunneling (
ssh -R11000:localhost:11000 user@host) to profile applications on remote Linux servers, forwarding data directly to your local devfiler instance.
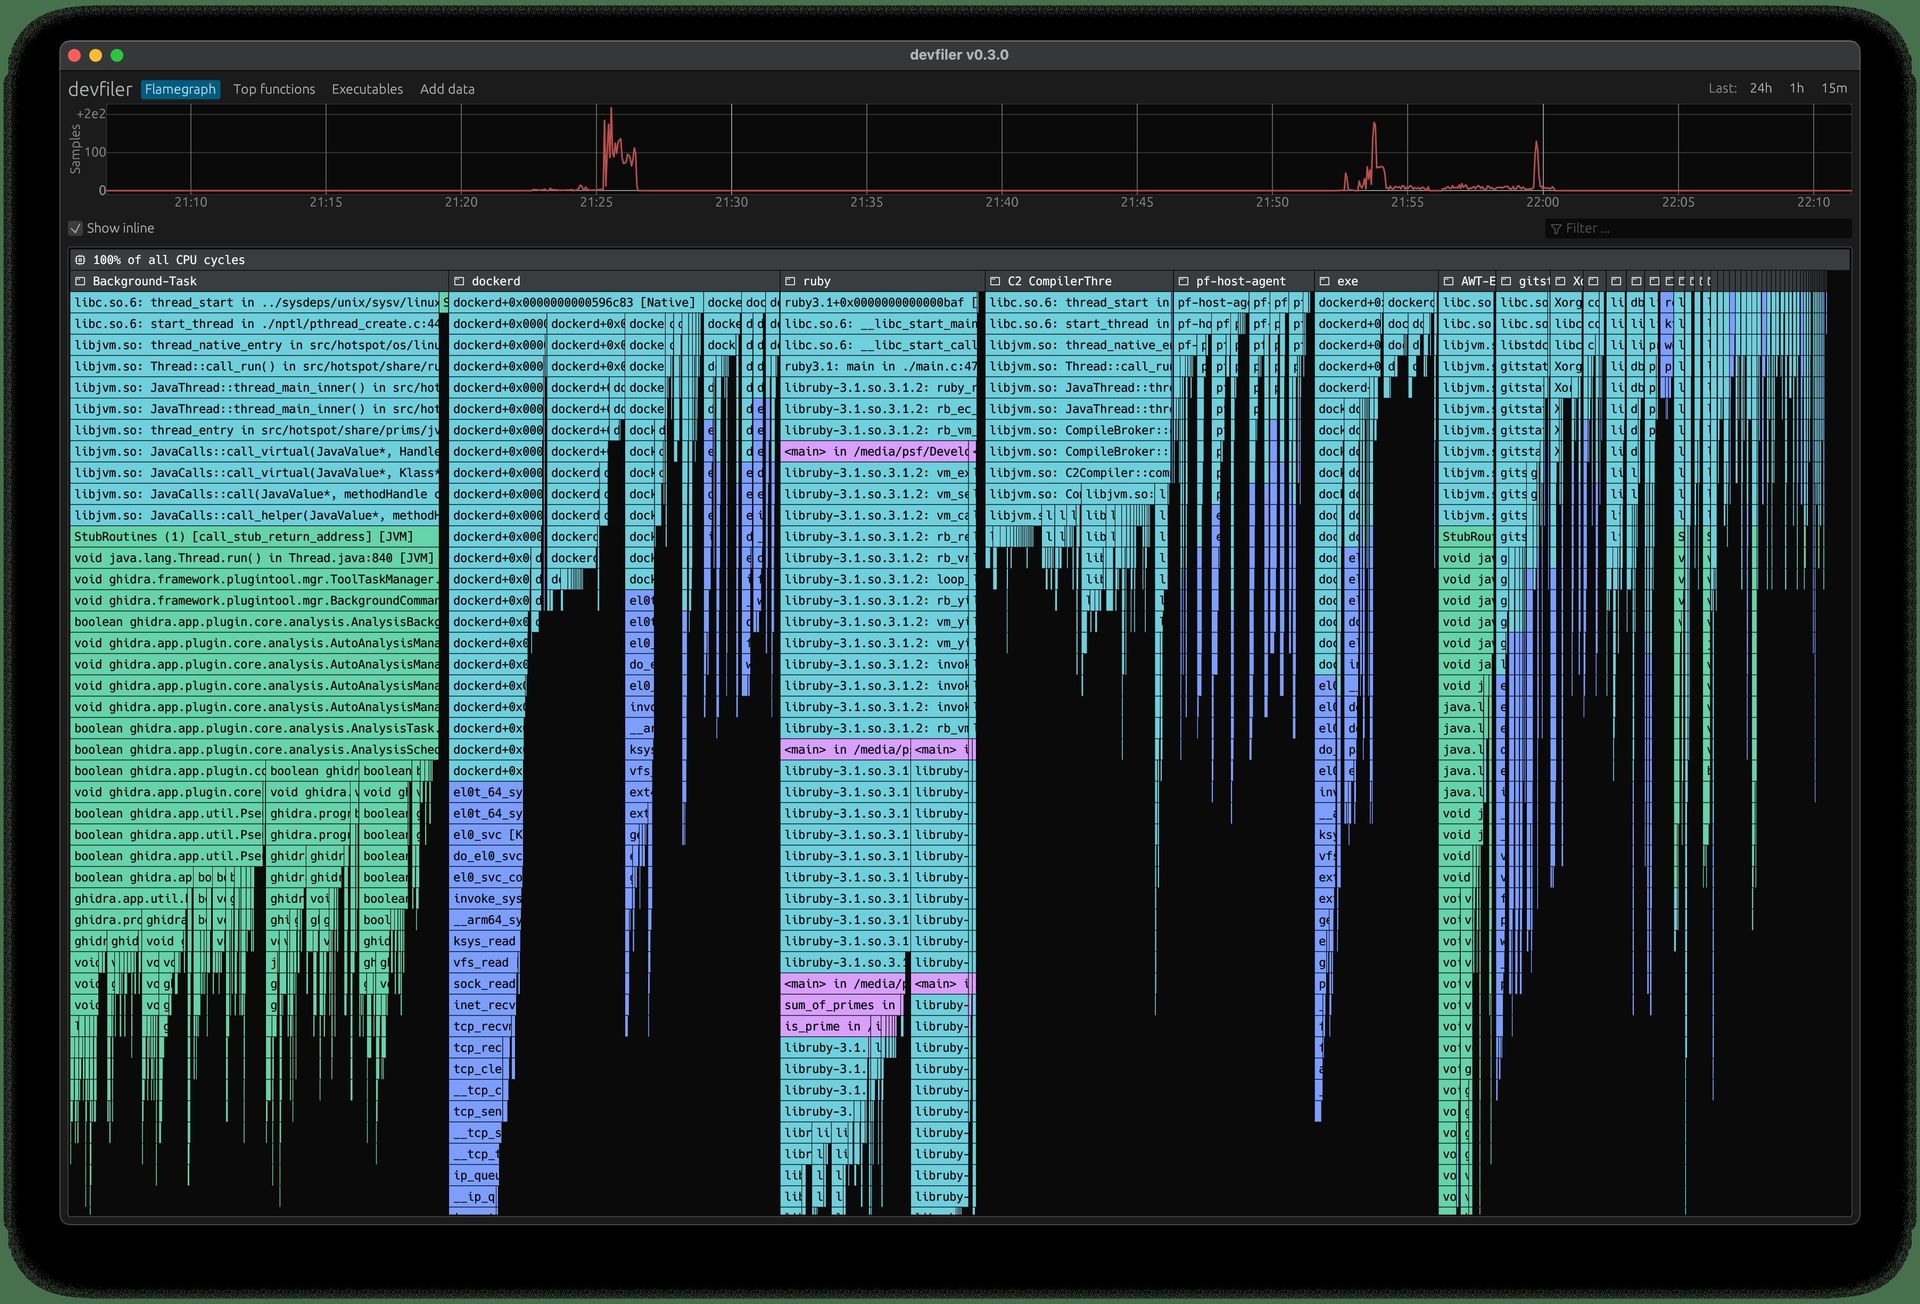 Screenshot: devfiler's interface visualizing profiling data (Source: Elastic GitHub)
Technical Execution
Developers can build devfiler via Nix (primary) or Cargo:
# Nix Build (with flakes enabled)
nix --experimental-features 'flakes nix-command' run '.?submodules=1#'

# Cargo Build (requires g++, libclang, protoc)
git submodule update --init --recursive
cargo build --release
Once running, ingest traces using the OTel eBPF Profiler:
sudo ./ebpf-profiler -collection-agent=127.0.0.1:11000 -disable-tls
Transparency and Customization
As an unsupported open-source tool, devfiler offers hidden developer features accessible via a double-click on the "devfiler" text in the UI. This reflects its origins as an internal accelerator, now shared to foster broader experimentation with OTLP profiling standards. Elastic explicitly notes that binary releases aren't provided due to complex dependency licensing, placing responsibility on users to comply with third-party terms when building distributions.
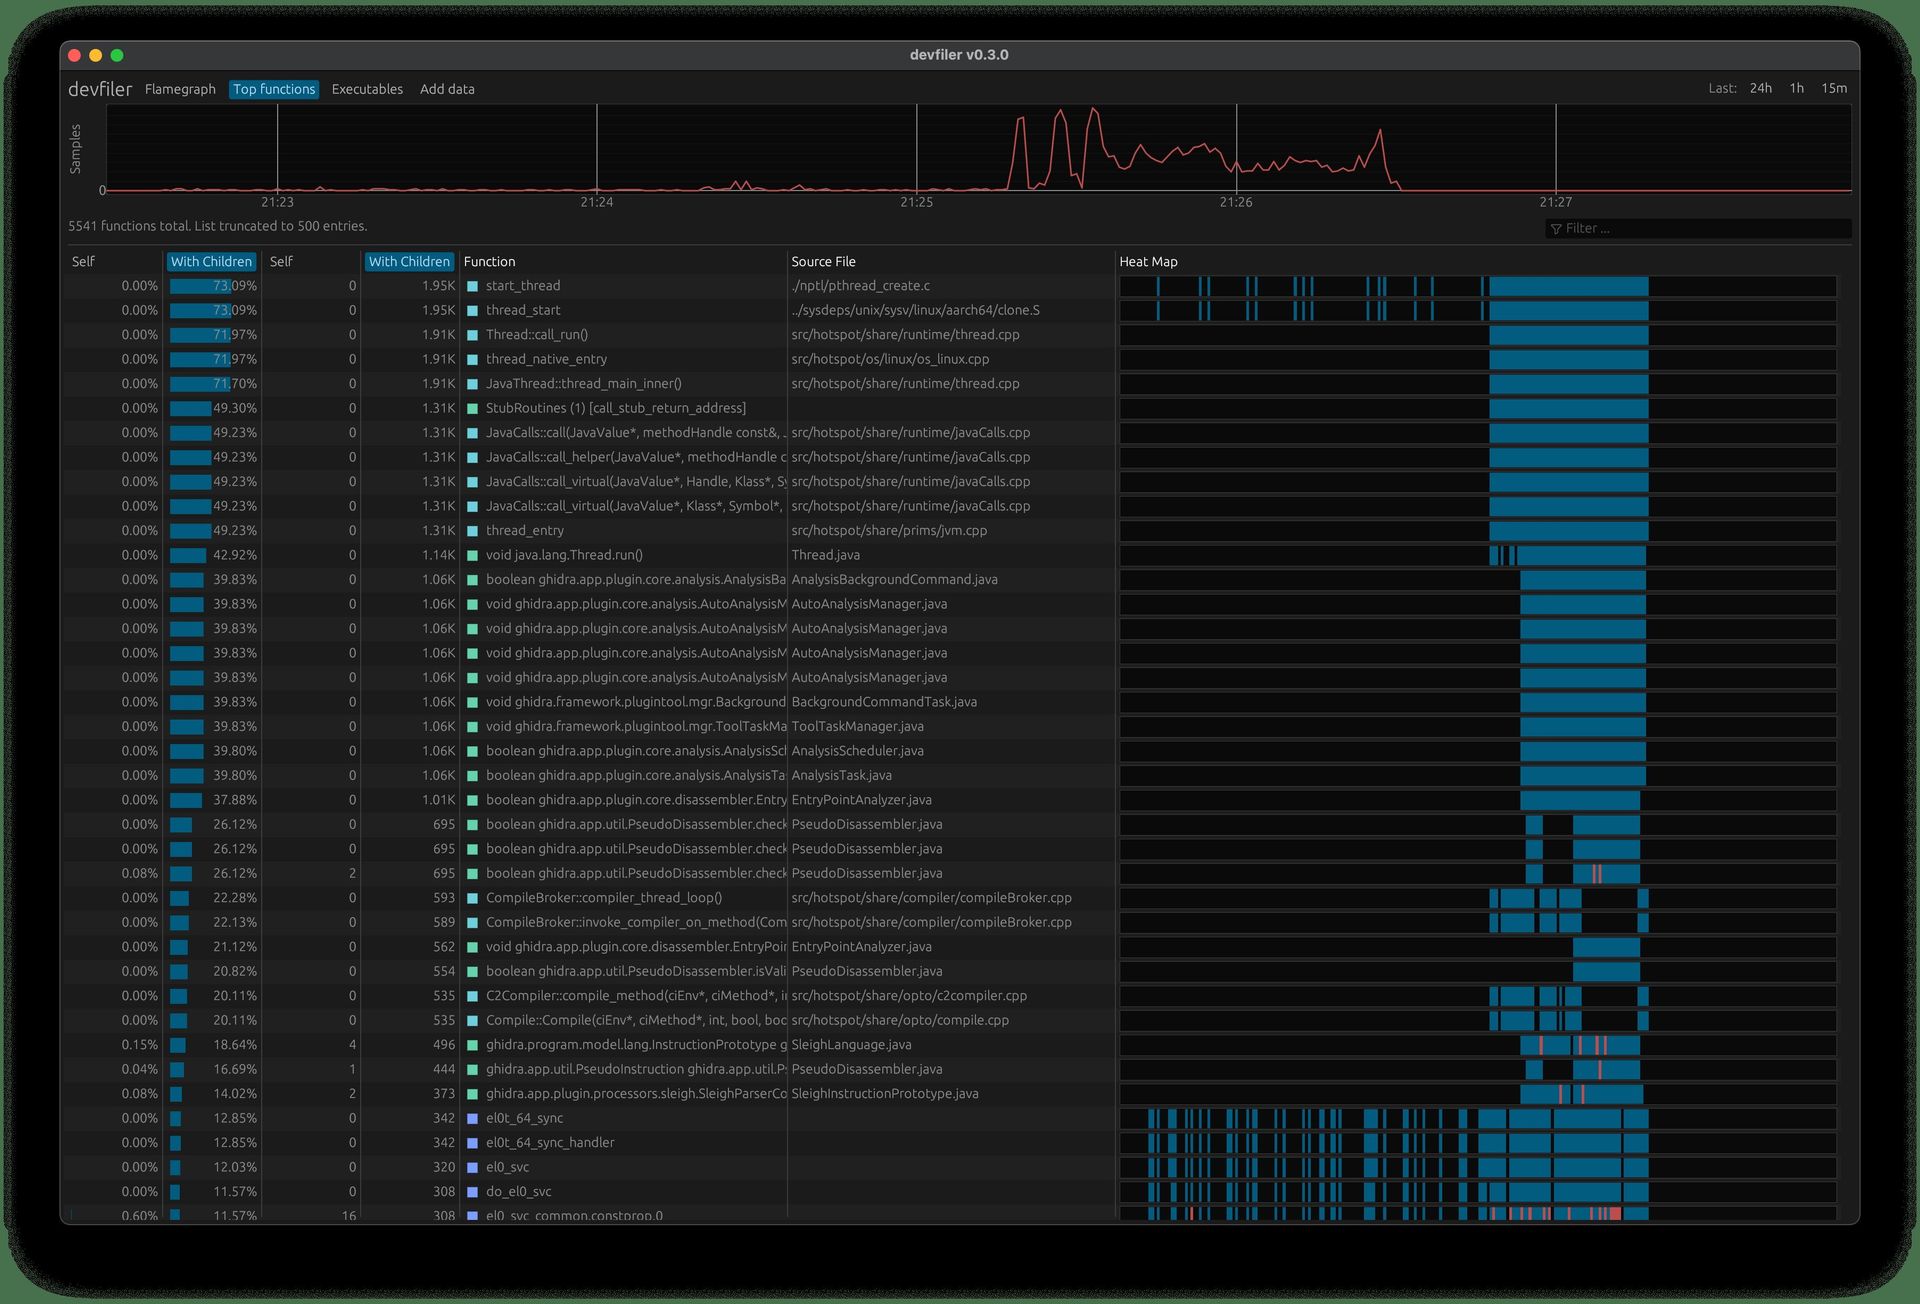 Screenshot: Advanced developer view in devfiler (Source: Elastic GitHub)
Why This Matters for Developers
devfiler democratizes low-overhead eBPF profiling by removing cloud dependencies and complex configurations. For performance engineers and backend developers, it enables rapid iteration: test profiling configurations locally, diagnose performance regressions in CI environments via SSH tunneling, or prototype enhancements to OTel’s profiling semantics. While not a production solution, it significantly lowers the learning curve for leveraging eBPF’s deep system introspection capabilities—potentially accelerating adoption of observability-driven development practices. As OTLP continues evolving, tools like devfiler provide the sandbox needed to push profiling innovation forward.
Comments
Please log in or register to join the discussion