Intel pushed a ground-up rewrite of its data center GPU management stack, trading the old REST API for a Go-based daemon with OpenTelemetry output. Arc Pro B-Series cards get a unified Windows and Linux tooling story, though the 2.0.0 cut drops some features that admins relied on.
Intel released XPU Manager 2.0 on June 10, a full overhaul of the monitoring and management software for its data center and workstation GPUs, landing just a week after the incremental 1.3.7 release. If you run Arc Pro cards in a server or homelab rack and you have been wrestling with the differences between the Windows and Linux builds, this release reworks the parts that made fleet management awkward.
What XPU Manager actually does
XPU Manager is Intel's answer to the kind of telemetry and control tooling that NVIDIA admins get from nvidia-smi and the Data Center GPU Manager. The headline component is xpu-smi, a command-line tool that reports per-device utilization, memory occupancy, power draw, clock frequencies, temperatures, and ECC error counts. Behind it sits a daemon that exposes the same data to fleet management systems so you are not SSHing into forty nodes to check whether one card is thermal throttling.
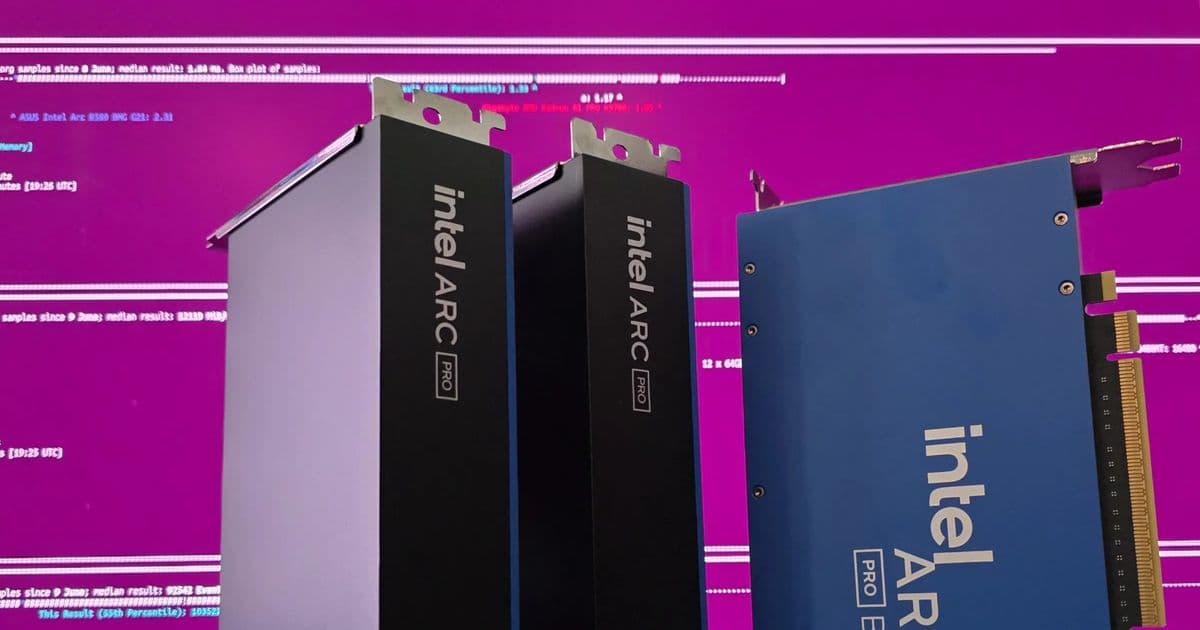
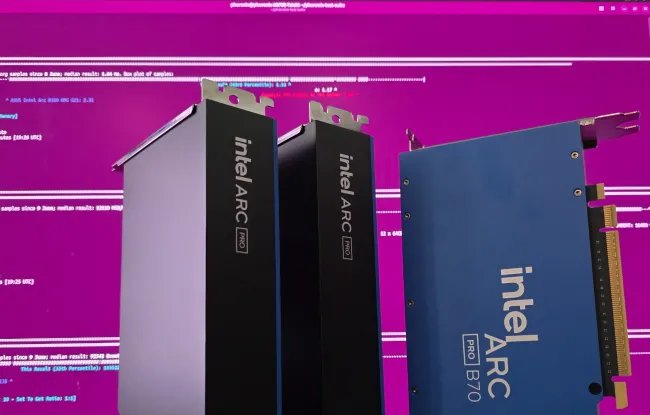
The project started life supporting the Data Center Flex Series and Max Series (Ponte Vecchio) accelerators. Over the past year, newer releases narrowed official support to the Arc Pro B-Series Battlemage cards, and 2.0 continues that focus. The officially supported list now reads Arc Pro B50, B60, B65, and B70, with no mention of the older Flex or Max parts in the support matrix.
The architectural changes that matter
The most consequential change is invisible at the command line: the management daemon has been rewritten from scratch in Go. The previous implementation carried separate code paths for Windows and Linux, which meant features landed unevenly and bugs got fixed twice or, more often, once. Intel's stated goal for 2.0 is eliminating that duplication so the two platforms track each other.
With the Go rewrite comes native OpenTelemetry export. This is the practical win for anyone already running a metrics pipeline. Instead of scraping a bespoke REST endpoint and writing a translation layer, you point the daemon at an OTLP collector and the GPU metrics flow into the same Prometheus, Grafana, or vendor backend that already ingests your node exporters and application traces. For a homelab that standardized on OpenTelemetry collectors, this removes a custom integration that previously had to be maintained by hand.
The rewrite also trims third-party dependencies, which matters more than it sounds. Fewer shared libraries means fewer version conflicts when you install the package on a host that is already running other Intel runtime components, and a smaller attack surface on machines exposed to a management network.
{{IMAGE:2}}
New capabilities in the CLI
Two additions stand out in xpu-smi itself. The tool can now display information on network interface cards alongside GPUs, which is a sensible consolidation given that Intel ships NICs into the same rack-scale deployments as its accelerators. There is also a new dashboard view, giving you a consolidated live readout rather than parsing individual subcommand output.
The table below summarizes how the major pieces shifted between the previous generation and 2.0:
| Component | Pre-2.0 | XPU Manager 2.0 |
|---|---|---|
| Daemon language | C/C++ | Go (rewritten) |
| Metrics export | REST API | OpenTelemetry (OTLP) |
| REST API | Present | Retired |
| C API | Present | Not in 2.0.0 |
| NIC monitoring | No | Yes |
| Dashboard view | No | Yes |
| Code paths | Separate per OS | Unified |
What you lose in the 2.0.0 cut
This is not a pure upgrade, and the regressions deserve a clear callout before you replace a working 1.3.x install. Intel retired the REST API entirely, and the C API is not functional in this initial 2.0.0 release. If your fleet automation or a custom dashboard talks to XPU Manager over REST, or if you link against the C API from your own code, this release breaks that integration outright. The migration path is OpenTelemetry, which covers the metrics-export use case well but does not replace the control and query surface that REST callers may have depended on. Plan to keep 1.3.7 around on production nodes until the C API returns and you have validated the OTLP path end to end.
Platform support and build notes
On Linux, official support covers Ubuntu 24.04 LTS and the newer Ubuntu 26.04 LTS. On the Windows side, it is Windows Server 2022, and Intel is explicit that the Windows build carries limited support relative to Linux. That asymmetry persists despite the unification work, so if you have a choice, the Linux build remains the reference platform for anything beyond basic monitoring.
For a homelab build standardizing on Arc Pro B60 or B70 cards for inference or transcoding duty, the recommended setup is Ubuntu 24.04 LTS with the 2.0 packages, an OpenTelemetry collector running locally, and a Grafana instance pulling the OTLP metrics. Keep power and thermal panels front and center, because the B-Series cards reward attention to sustained clocks under load, and xpu-smi now gives you the per-device power draw needed to size your PSU headroom honestly rather than trusting board TDP figures.
Intel framing the continued investment around the upcoming Crescent Island AI accelerator suggests XPU Manager is meant to be the long-lived management layer for its data center roadmap, not a Battlemage-era stopgap. That makes the Go rewrite and the OpenTelemetry bet reasonable foundations to build tooling against, with the caveat that the retired APIs make this a release to test in a lab before it touches anything you depend on. Downloads and the full changelog are on the project's GitHub releases page.
Comments
Please log in or register to join the discussion