QueueWatch introduces a lightweight, open‑source dashboard that gives developers instant insight into the health and performance of Kafka and RabbitMQ clusters. By surfacing key metrics and alerting on anomalies, the tool helps teams preempt bottlenecks and maintain reliable message flows.
QueueWatch Unveils Real‑Time Message Queue Visibility for Kafka and RabbitMQ
In an era where microservices and event‑driven architectures dominate, the health of underlying message queues can make or break an application’s reliability. QueueWatch, a newly released open‑source monitoring solution, promises to bring that visibility to developers’ fingertips.
“QueueWatch fills a critical gap in our observability stack,” says Alex Rivera, senior infrastructure engineer at a leading fintech firm. “We’re now able to see queue depth, consumer lag, and throughput in real time without juggling multiple tools.”
What QueueWatch Offers
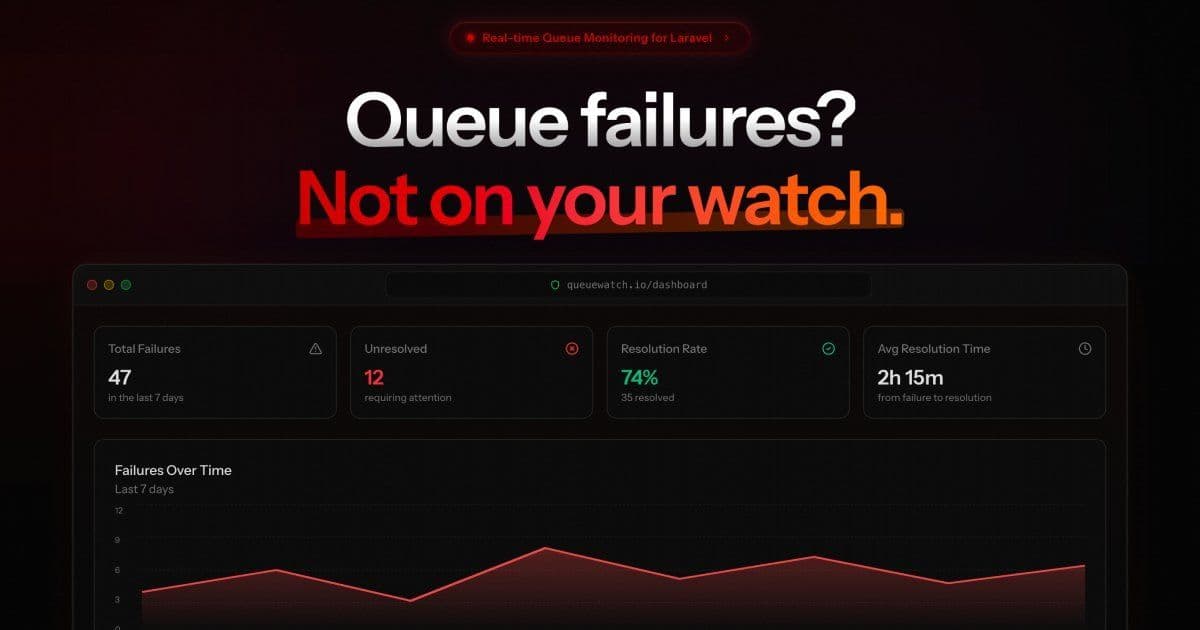
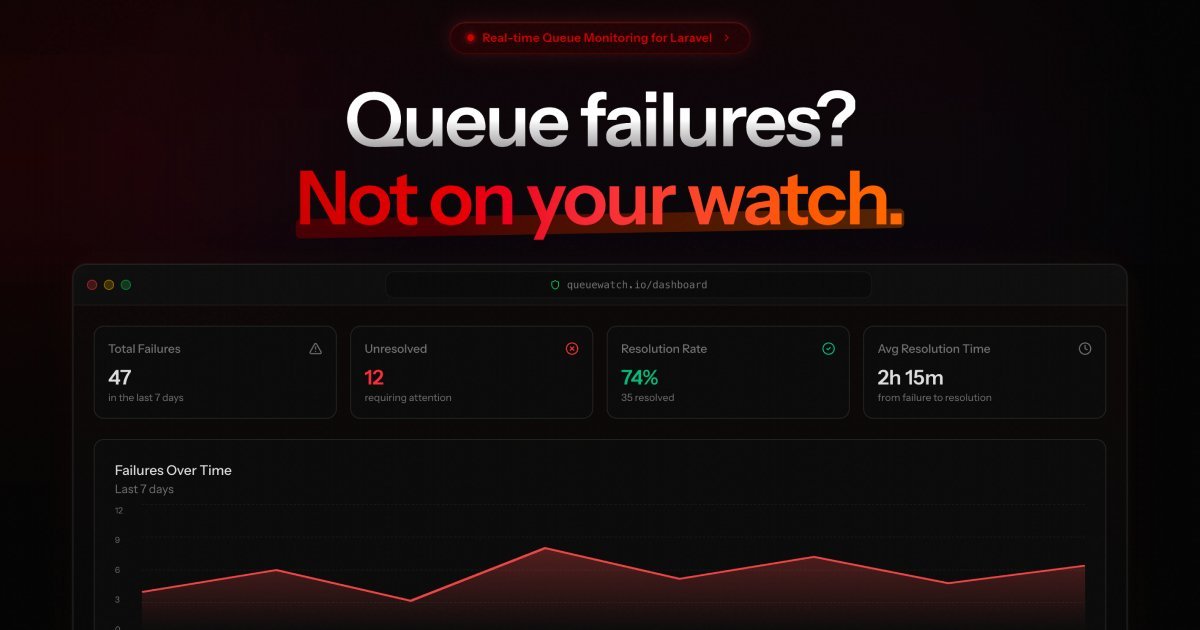
QueueWatch is a lightweight, browser‑based dashboard that pulls metrics from Kafka and RabbitMQ via their native JMX and HTTP endpoints. Key features include:
- Live Queue Depth & Consumer Lag – Visualize how many messages are waiting and how far consumers are behind.
- Throughput & Latency Charts – Track message rates and end‑to‑end latency per topic or queue.
- Alerting Engine – Configure thresholds for key metrics and receive alerts via Slack, email, or webhook.
- Historical Data Storage – Persist metrics in a local InfluxDB instance for trend analysis.
- Zero‑Configuration Deployment – Run the dashboard in a single Docker container with minimal setup.
The tool’s architecture is intentionally simple: a Node.js backend scrapes metrics, while a React front‑end renders interactive charts. This design keeps resource usage low, making QueueWatch suitable for both production clusters and local development environments.
Why It Matters
Message queues are often the invisible backbone of distributed systems. When a queue becomes saturated or a consumer lags, downstream services can stall, leading to cascading failures. Traditional monitoring solutions either require complex instrumentation or focus on metrics that are hard to interpret for developers.
QueueWatch’s focus on actionable metrics—such as consumer lag and queue depth—enables teams to detect problems before they surface as latency spikes or timeouts. By integrating alerting directly into the dashboard, developers can respond immediately, reducing mean time to recovery.
Adoption and Community
Since its public release, QueueWatch has seen rapid uptake. The project’s GitHub repository reports over 3,000 stars and a growing list of contributors. The community has already forked the repository to add support for other brokers like Amazon SQS and Google Pub/Sub.
The open‑source nature also means companies can extend the tool to fit their specific observability pipelines. For instance, a recent pull request added Grafana dashboards that consume the same InfluxDB data, allowing teams to embed QueueWatch metrics into their existing Grafana stacks.
Looking Ahead
QueueWatch’s creators are already planning enhancements. Planned features include:
- Distributed Tracing Integration – Correlate queue metrics with OpenTelemetry traces for end‑to‑end visibility.
- Auto‑Discovery of Brokers – Dynamically detect new topics or queues without manual configuration.
- Advanced Alert Rules – Support for percentile‑based thresholds and anomaly detection.
For developers building event‑driven systems, QueueWatch offers a pragmatic, low‑overhead solution to keep message pipelines healthy. As the ecosystem evolves, the tool’s community‑driven roadmap suggests it will remain a relevant part of the observability toolkit.
“QueueWatch is a game‑changer for teams that need to see their queues in real time without the overhead of a full‑blown APM,” notes Rivera. “It’s the kind of tool that quietly keeps the system humming.”
Source: https://queuewatch.io
Comments
Please log in or register to join the discussion