
After years of debugging web performance issues, Automattic's performance specialist argues that JavaScript-heavy frameworks like React create unsustainable performance debt despite promises of developer efficiency.
For web developers prioritizing long-term performance, JavaScript-heavy frameworks like React often create more problems than they solve. Despite industry promises of improved developer experience and agility, these approaches consistently introduce performance bottlenecks that compound over time and prove difficult to maintain.
The Hidden Costs of JavaScript Dependencies
JavaScript-heavy development leans heavily on npm dependencies, creating invisible performance tax:
- Bundle bloat: Libraries like Moment.js (+10% over 5 years) and React DOM (+33% from v18 to v19) grow relentlessly
- Tooling gaps: npm/dependabot don't warn about size increases; bundlers often hide bundle metrics by default
- Dependency traps: Security updates force upgrades to heavier versions, while avoiding updates creates maintenance debt
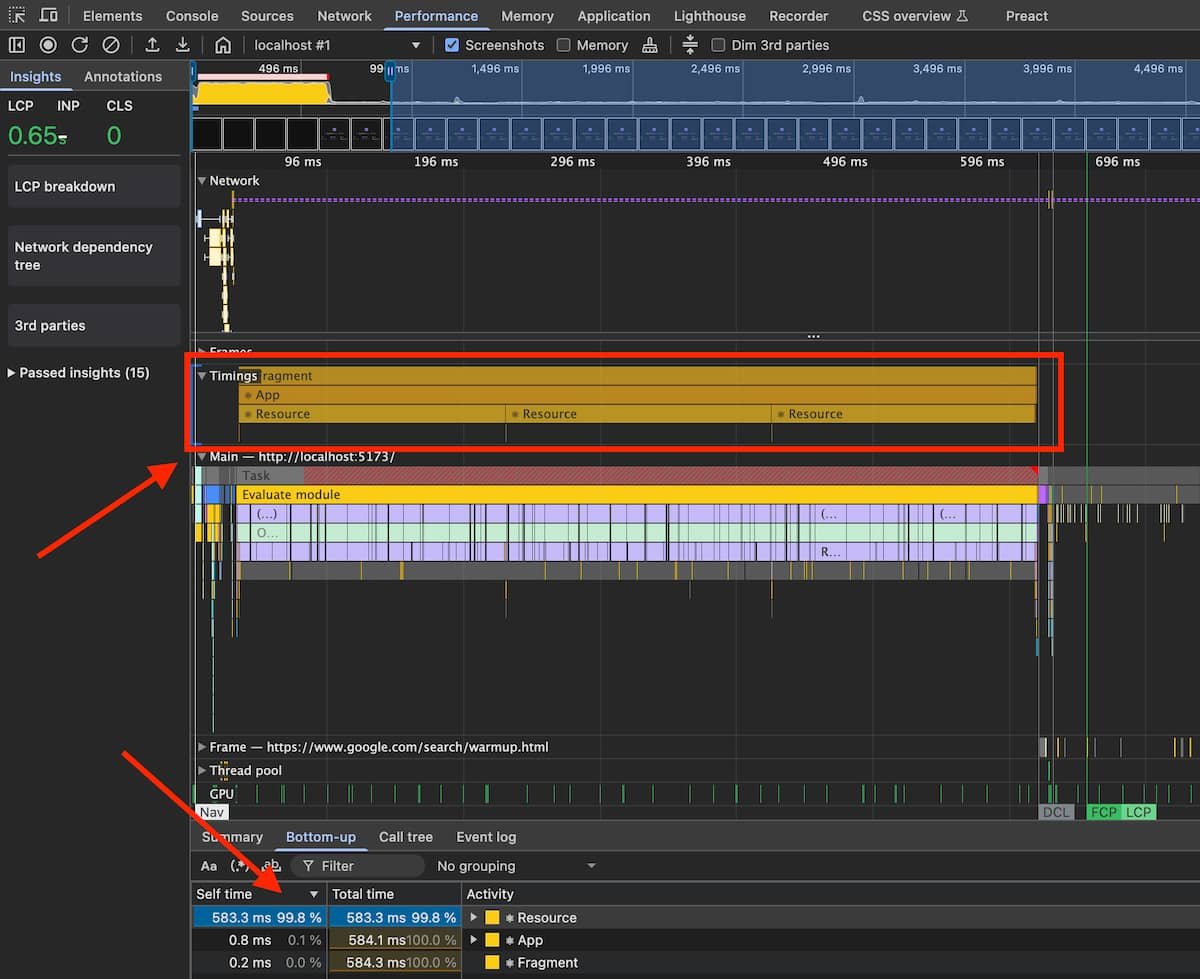 Preact's DevTools integrate framework timing into browser profiles - a model React should follow
Performance Pitfalls in Practice
Frameworks often incentivize performance-antipatterns:
- Top-level context overuse forces unnecessary pre-loading
- Synchronous imports trump conditional loading
- Monolithic bundles prevail over complex code-splitting
- Redux reducers/selectors often trigger entire subtree re-renders
"These frameworks make it easier to do the wrong thing than the right thing performance-wise," notes the author. Worse, single missteps can undo months of optimization work when dependencies resurface or critical paths get bloated.
The Debugging Disconnect
While browser DevTools offer powerful profiling, frameworks like React fracture visibility:
- React DevTools operate separately from browser profilers
- No combined view of framework/browser execution timelines
- Hydration errors produce vague messages like "Did not expect server HTML to contain in "
- Production debugging requires special profiling builds
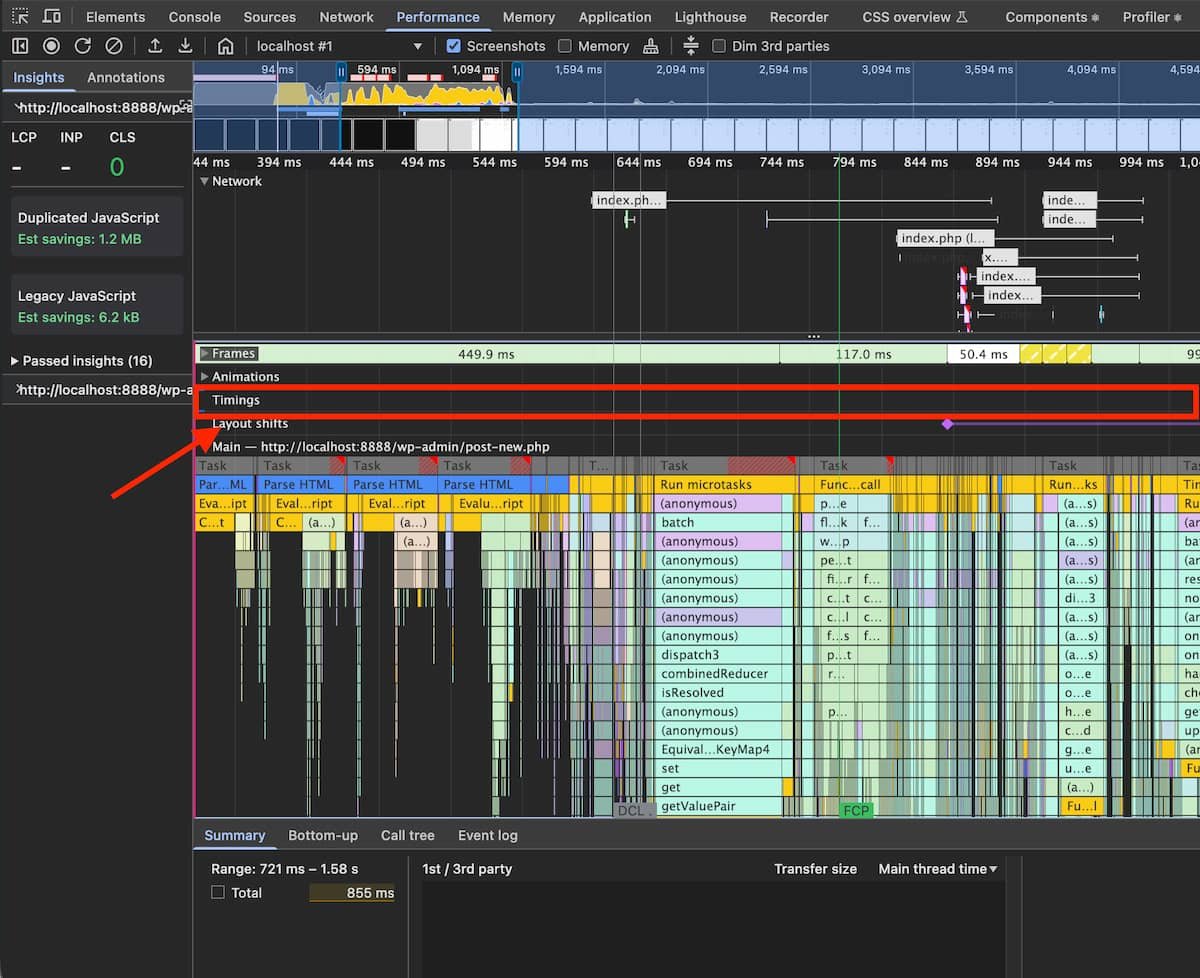 React's separate tooling obscures performance insights available in native browser profiles
Mitigation Strategies
For teams committed to JS-heavy stacks:
- Set strict performance budgets tied to business metrics
- Enforce code-splitting per route with shared common chunks
- Implement bundle tracking with CI alerts for size regressions
- Ban problematic patterns via lint rules (monolithic imports, etc.)
- Monitor real-user metrics with detailed debug context
The Server-Centric Alternative
Shifting logic to servers creates more sustainable performance:
- Leverages powerful, controlled environments rather than user devices
- Reduces bundle sizes dramatically
- Enables simpler performance monitoring
- Works with modern patterns like View Transitions API or HTMX
While client-side apps suit complex editors, most websites benefit from HTML-centric architectures. For SPAs, smaller frameworks like Preact or fine-grained reactivity libraries offer better performance fundamentals than React's diff-heavy model.
"We're borrowing users' devices to do work our servers could handle," the author concludes. "It's time to prioritize user experience over developer familiarity when choosing architectures."
Comments
Please log in or register to join the discussion