Despite building over a million houses a year in the United States, the homebuilding sector shows surprisingly weak economies of scale. The article traces this paradox to the low “output‑to‑input” cost ratio of residential construction, the fragmented market structure, limited automation, and the low dollar density of finished homes, which together cap the potential savings from scale.
Why Homebuilding Defies Traditional Economies of Scale
 Featured image
Over the past year we have mapped two persistent facts about the construction sector: productivity improvements lag far behind those of manufacturing, and construction costs tend to rise at or above overall inflation. The natural next question is why these patterns are so entrenched. One of the most powerful levers for reducing unit costs in any industry is economies of scale – the tendency for per‑unit expenses to fall as output expands. In theory, the United States builds enough houses each year for scale to matter, yet the data tell a different story. This essay unpacks the structural reasons why scale‑driven savings remain modest in homebuilding, and what that implies for future attempts at cost reduction.
The Conventional Expectation of Scale
In many sectors – oil refining, automobile assembly, consumer electronics – a larger plant can spread fixed capital, purchase inputs in bulk, and reap learning‑by‑doing benefits. The classic illustration is the gasoline “crack spread”: crude oil might cost $55 / barrel while wholesale gasoline sells for $70, leaving a margin of roughly $15. Because a refinery processes millions of barrels, that margin supports massive fixed‑cost recovery and still leaves room for profit.
Car manufacturing shows a similar pattern. A detailed cost breakdown of the BMW i3 reveals that material inputs account for about 55 % of the vehicle’s price, while labor, tooling, and overhead make up the remainder. The ratio of output cost to material cost hovers around 1.8, a figure that can be driven down further by building larger, more automated plants.
When the same logic is applied to residential construction, the numbers look very different.
The Homebuilding Cost Structure
A typical single‑family home in the United States incurs roughly 50 % labor and 50 % materials in its hard‑cost estimate (see the Craftsman National Construction Estimator data). This yields an output‑to‑input cost ratio of about 2 – only slightly higher than the ratio observed for a high‑tech car sub‑assembly. In other words, the transformation from lumber, drywall, concrete, and shingles into a finished dwelling is relatively inexpensive in terms of added processing.
When the ratio is already low, there is little “headroom” for scale to shave off costs. Adding a $10 million assembly line that can produce 10 % more houses per year would only reduce the overall cost per house by a few dollars, a change that is easily eclipsed by fluctuations in material prices, land costs, or local labor rates.
Fragmented Market and Limited Concentration
If scale were a viable lever, we would expect the industry to consolidate around a few large players, as happens in aerospace or automotive sectors. The reality is the opposite. According to a 2022 Harvard Joint Center for Housing Studies (JCHS) report, over 65,000 firms are active in U.S. homebuilding, and the top 100 firms together command less than 50 % of the market. The four largest builders – Lennar, D.R. Horton, Pulte, and NVR – hold only about 18 % of total starts, compared with 90 % concentration in aircraft manufacturing.
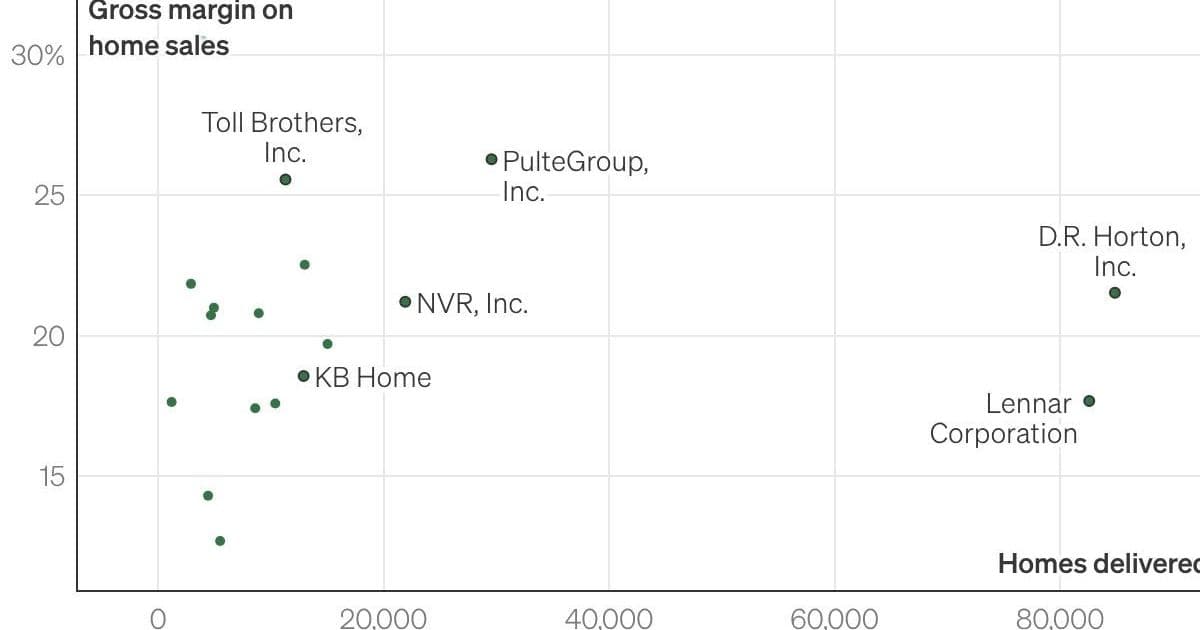
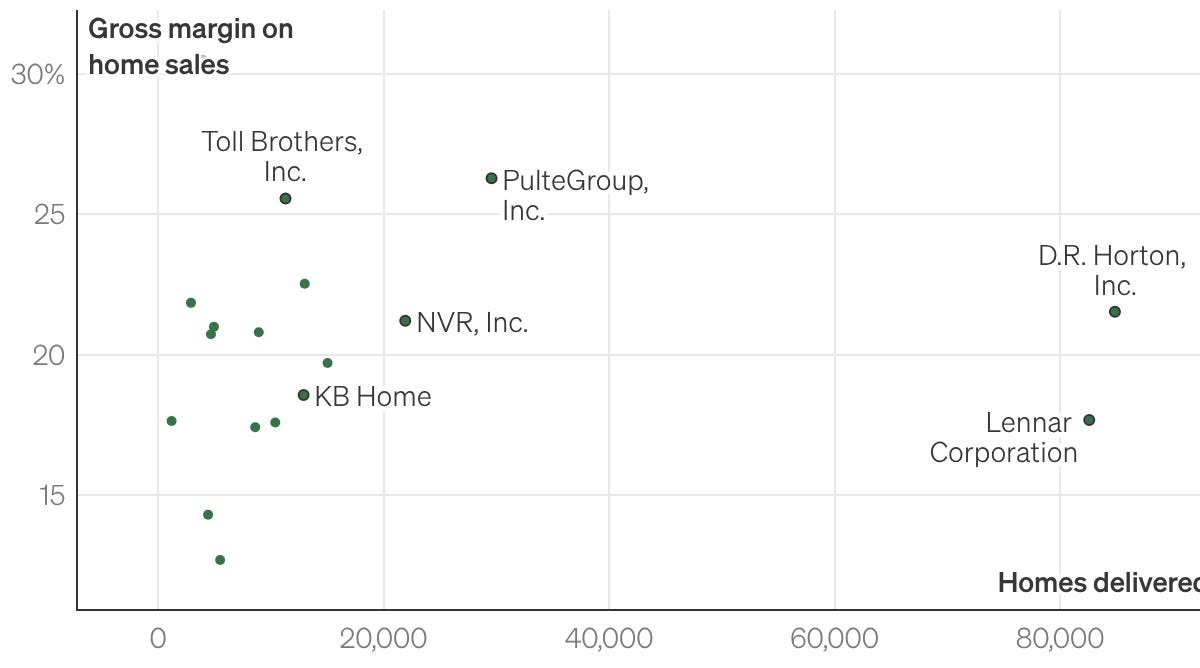
Empirical evidence supports the notion that scale does not translate into cost advantage. A late‑1990s JCHS study found that the largest builders actually incurred higher construction costs than smaller firms, and more recent public‑company data show virtually no correlation between the number of homes built and gross margins. Lennar’s 2025 gross margin mirrors that of United Homes Group, despite building more than sixty‑times as many houses.
Manufactured Housing – The ‘Clean‑Room’ Test
Manufactured (mobile) homes provide a natural laboratory because they are produced in factories, follow a single federal HUD code, and are shipped to sites rather than built on‑site. The sector is far more concentrated: Clayton Homes, Cavco, and Champion together account for roughly 90 % of U.S. output, with annual volumes of 49 k, 20 k, and 26 k units respectively.
Even with this concentration, scale benefits remain modest. Four public manufacturers – Champion, Cavco, Legacy Housing, and Nobility Homes – exhibit similar gross margins across a ten‑fold range of output. Smaller players sometimes achieve higher margins, suggesting that the marginal cost of adding another 1,000 homes in a factory is not dramatically lower than the marginal cost of the first 1,000.
Factory footprints are also telling. Most plants are 100–200 k sq ft, employ 100–300 workers, and produce several hundred homes per year. By contrast, a single modern auto plant can output 500 k+ vehicles annually. The limited capacity per facility stems partly from the low dollar density of a manufactured home – the value per cubic foot is small, making long‑distance trucking expensive. As the article notes, a typical cost‑effective shipping radius is about 350 miles; beyond that, transportation eats a sizable share of the margin.
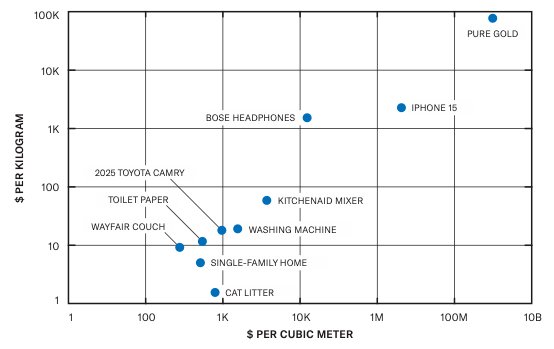 Caption: Dollar density of various products, via The Origins of Efficiency.
If transportation were the only barrier, we would expect firms to merge nearby plants into larger hubs. Yet many manufacturers operate multiple facilities within a 100‑mile radius, indicating that even when logistics permit consolidation, the economic incentive to do so is weak.
The Core Limiting Factor: A Low Idiot Index
Elon Musk once described the ratio of a product’s final price to its raw‑material cost as the “idiot index.” A high index signals abundant waste and room for improvement; a low index suggests the process is already close to the material cost floor.
For a typical house, the idiot index is roughly 2 (output cost ≈ 2 × material cost). In contrast, a refinery’s gasoline spread reflects an index of ~1.3, and a complex car sub‑assembly sits around 1.8. When the index is low, the potential savings from scaling – spreading fixed plant costs, investing in high‑capacity equipment, or automating repetitive steps – are inherently limited.
The construction industry’s labor‑intensive nature compounds the issue. Even in a factory setting, most tasks are performed by skilled workers using hand tools; equipment value is often ≤ 50 % of the building’s value, whereas in automotive plants equipment exceeds 300 % of the building value. The modest automation ceiling means that adding a new robotic station yields only marginal cost reductions.
Implications and Paths Forward
- Target High‑Index Sectors – Projects with a high output‑to‑input cost ratio (e.g., nuclear plant construction, large‑scale infrastructure) may offer richer opportunities for scale‑driven savings.
- Vertical Integration of Materials – Controlling the supply chain for lumber, steel, or prefabricated panels could shave a few percentage points off material costs, but the overall impact remains bounded by the low index.
- Material Substitution – Reducing the amount of material required per square foot (through advanced framing, engineered wood, or 3‑D‑printed components) could lower the base input cost, thereby widening the gap that scale could exploit.
- Localized Modular Production – Instead of chasing national‑scale factories, firms might focus on regional “micro‑hubs” that balance transportation costs with modest automation, accepting that the scale ceiling is lower than in other industries.
Conclusion
Economies of scale are a potent lever only when there is a sizable margin between raw‑material costs and finished‑product costs. Residential construction, by virtue of its modest transformation ratio, already operates near that margin. The fragmented market, low dollar density of finished homes, and limited automation together ensure that expanding output does not dramatically lower per‑unit expenses.
Understanding this structural constraint reframes the conversation about how to make housing more affordable. Rather than hoping that bigger builders will automatically drive down prices, policymakers and industry leaders should look toward material efficiency, design innovation, and targeted automation in high‑index sub‑sectors. Those avenues, rather than sheer scale, are likely to deliver the next meaningful reductions in homebuilding costs.
Brian Potter is the author of the Construction Physics newsletter, where he examines the engineering and economic forces shaping the built environment.
Comments
Please log in or register to join the discussion