
ZenithTrack visualizes the night sky at extreme magnification, turning the Earth's spin into a real‑time animation. Built on Pan‑STARRS imagery and SIMBAD data, the entirely client‑side app lets anyone watch stars crawl across a rice‑grain‑wide slice of the heavens.
ZenithTrack – A Real‑Time View of the Stars
The problem: making the Earth’s rotation visible
When you look up at the night sky, the stars appear fixed for minutes, then drift imperceptibly as the planet turns. Astronomers counter that drift with motorised equatorial mounts, but for most people the motion remains an abstract concept. ZenithTrack asks a simple question: What would the sky look like if we could zoom in enough that the Earth’s rotation became obvious in real time?
The answer is a thin “ribbon” of sky about the size of a grain of rice held at arm’s length. At roughly 180× magnification, a star moves the width of the screen in just 30 seconds, turning the planet’s spin into a visible sweep.
How it works
Data sources
- Images – The visual backdrop comes from the Pan‑STARRS1 survey (2010‑2014). With a resolution of 0.26 arcseconds per pixel, a 1 000‑pixel‑wide browser window covers about 4.3 arcminutes, exactly the field needed for the ribbon effect. The raw tiles are served directly from the MAST archive at STScI, so ZenithTrack never stores the data itself.
- Object names – When the ribbon lands on a star, ZenithTrack queries the SIMBAD astronomical database for identifiers, cross‑matching the coordinates to within a pixel.
Rendering pipeline
- Tile handling – Although the celestial sphere is curved, at the extreme zoom level each image tile can be treated as a flat rectangle. This lets the project reuse Leaflet.js, a library originally built for Earth maps, to manage panning, layering and the coordinate grid.
- Coordinate grid – The overlay shows right‑ascension and declination lines spaced at 0.5 arcminutes, mirroring latitude/longitude on Earth. The grid contracts toward the poles, just as RA lines converge.
- Client‑side processing – All logic runs in the browser (plain JavaScript). There is no back‑end, which means zero server cost and immediate privacy: the location request used to centre the view never leaves the user’s device.
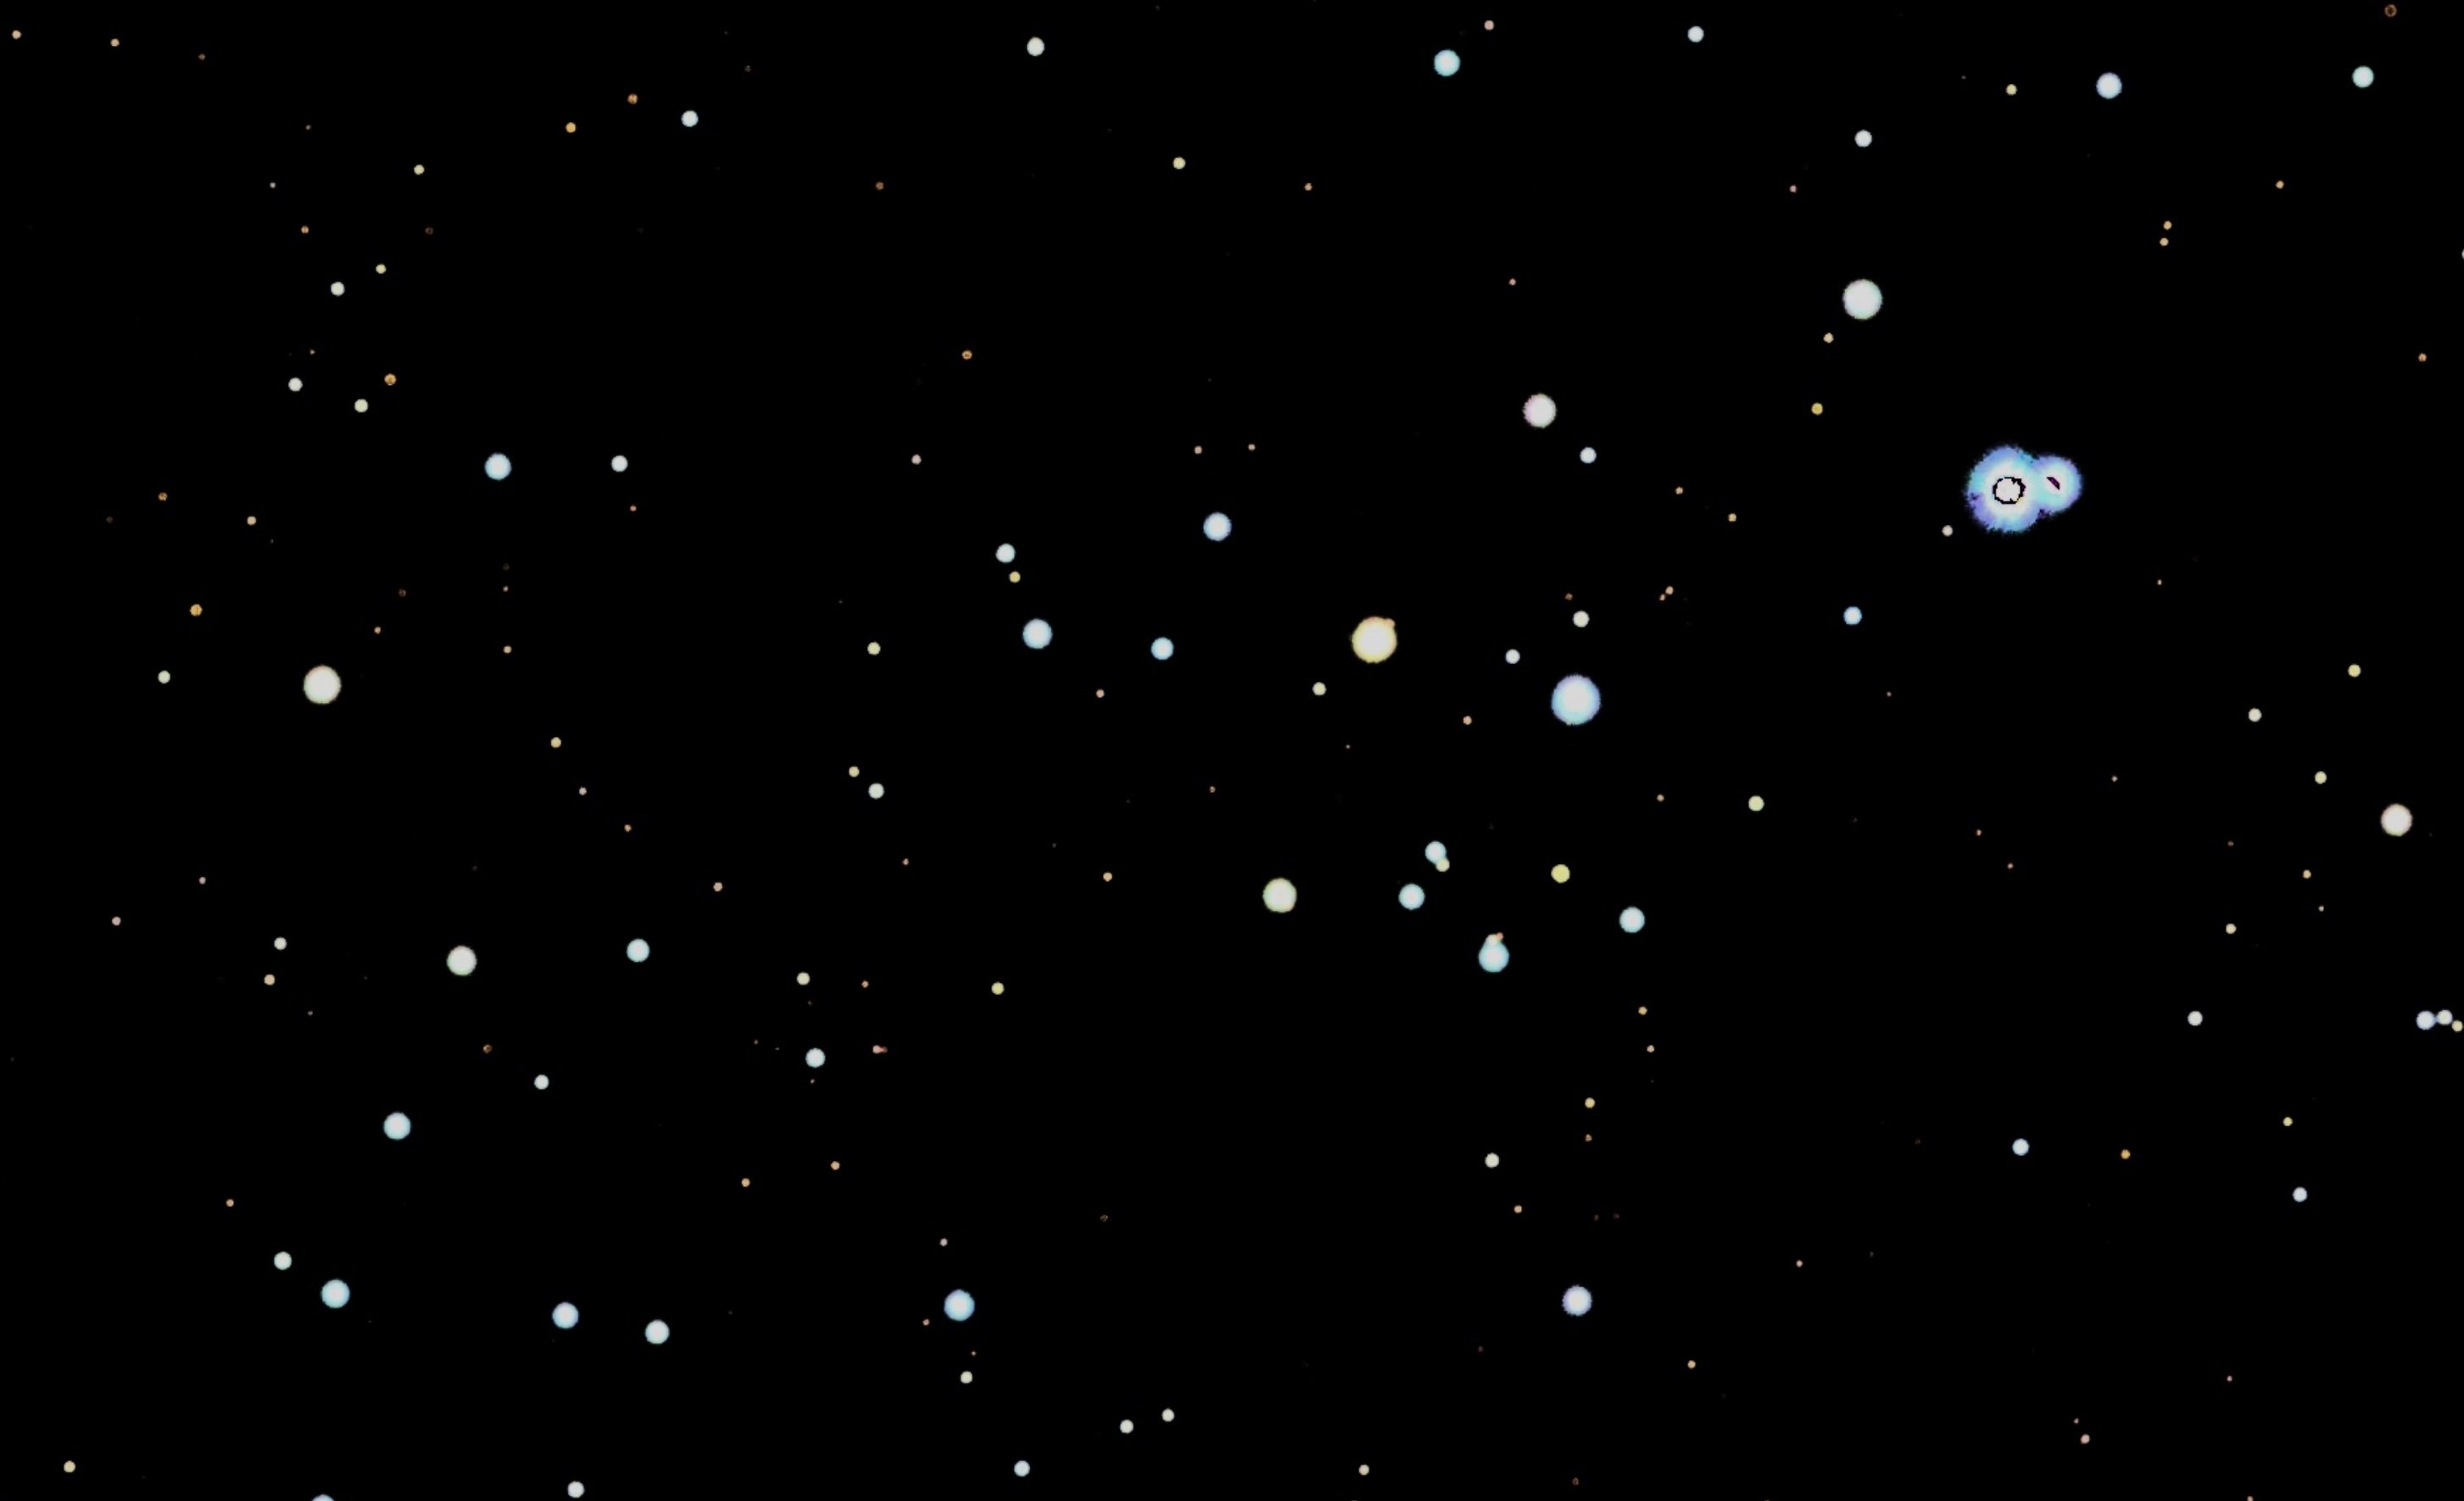
- Image cleanup – Pan‑STARRS was designed for asteroid detection, not for pristine star images. Bright stars often saturate the sensor, leaving green or red blobs. ZenithTrack applies two simple filters:
- White‑edge removal – trims incomplete tile borders.
- Aggressive noise threshold – darkens spurious pixels, though it sometimes strips colour from faint red stars. The team is experimenting with topology‑based heuristics (e.g., “green blobs surrounded by white”) to recover more natural colours.
Personal ribbon concept
The ribbon is a sidereal strip: it repeats every 23 h 56 m, independent of seasons. Two users at the same latitude see the exact same movie, just offset in time. Move five miles north or south and the ribbon changes entirely; move east or west and you get the same ribbon, shifted in phase. This property makes the experience uniquely local while still being globally synchronised.
Why Pan‑STARRS and not another survey?
The key requirement is a field of view on the order of a few arcminutes combined with sub‑arcsecond resolution. Pan‑STARRS delivers 0.26″/pixel, which translates to roughly 4.3′ across a typical 1 000‑pixel canvas – just enough to fit the 30‑second motion window. Other surveys either lack the necessary resolution or do not cover the whole sky.
Current limitations and next steps
- Oversaturation – Bright stars still bleed colour, creating the green blobs visible in the “before” screenshots. The team is prototyping a colour‑neutralisation step that replaces near‑monochromatic pixels with white, but this can dull genuine red stars.
- Ceiling installation – An experimental concept envisions projecting the ribbon onto a ceiling, turning a room into a live planetarium. This would require a calibrated projector and a simple web‑page wrapper.
- Community contributions – Because the code lives on a public GitHub page, anyone can fork the repo, improve the image‑cleaning algorithm, or add new overlays (e.g., constellations, deep‑sky objects).
Funding and traction
ZenithTrack is a hobby‑level project maintained by a small open‑source team. It has not raised external capital; development is funded through personal time and modest donations via the project’s GitHub Sponsors page. Despite the lack of formal backing, the tool has attracted attention from astronomy educators and hobbyists who appreciate a tangible way to demonstrate Earth’s rotation without a telescope mount.
Getting started
Visit the live demo at zenithtrack.smorgasb.org. Allow the site to access your location for the most accurate sky view, or click the fallback to see the sky over Stonehenge. The source code, including the image‑processing scripts, is available on GitHub.
ZenithTrack turns a subtle astronomical effect into a visual experience you can watch on any modern browser, all while keeping your data private and the infrastructure cost near zero.
Comments
Please log in or register to join the discussion