AWS has introduced public preview of OpenTelemetry metrics support in CloudWatch, completing its observability triad and allowing teams to standardize on open telemetry protocols across all three pillars.
Amazon CloudWatch has announced the public preview of OpenTelemetry metrics support, a significant development that completes the observability platform's support for all three telemetry pillars. This update allows developers to send metrics directly to CloudWatch using the OpenTelemetry Protocol (OTLP), enabling organizations to standardize on open telemetry standards while leveraging AWS's managed observability services.
Service Update: What's New
The preview introduces several key capabilities:
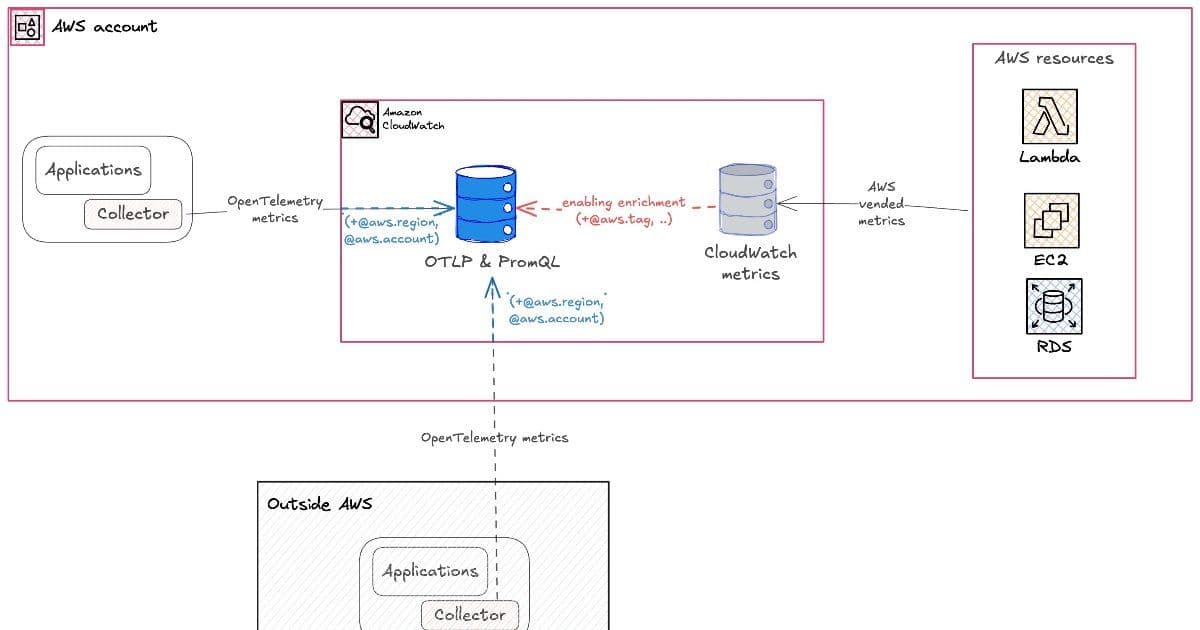
Native OTLP Metrics Ingestion: CloudWatch now accepts metrics through its OTLP endpoints, complementing existing support for traces and logs. This means organizations can send all telemetry data to CloudWatch using a single protocol.
High-Cardinality Metrics Store: The service supports up to 150 labels per metric, allowing rich metrics to be sent directly to CloudWatch without conversion or truncation. This addresses a common challenge in observability where high-cardinality metrics provide valuable context but are often limited by other platforms.
Automatic Resource Metadata Enrichment: AWS automatically adds resource metadata to metrics, including account ID, region, cluster ARN, and resource tags from AWS Resource Explorer. This enrichment happens without additional instrumentation, providing immediate context for metrics analysis.
PromQL Support: Teams can now analyze metrics using PromQL, the query language used in Prometheus, within the CloudWatch console. This allows teams already using Prometheus to reuse existing query knowledge and tools.
OpenTelemetry-based Container Insights: In a related announcement, AWS introduced the preview of OpenTelemetry-based Container Insights for Amazon EKS, extending existing capabilities by collecting additional metrics from open source and AWS collectors.
The service is currently available in five regions, including Northern Virginia and Ireland, with no charge during the preview period.
Use Cases: When to Use This Integration
Standardizing on OpenTelemetry
Organizations adopting OpenTelemetry as their standard telemetry framework can now send all three types of telemetry data—metrics, traces, and logs—to CloudWatch through a single protocol. This simplifies the observability stack and reduces the need for multiple data pipelines.
For example, a company running a microservices architecture can instrument applications once with OpenTelemetry and send all telemetry data to CloudWatch, regardless of whether the services run on AWS, on-premises, or in other clouds.
Multi-Environment Monitoring
The ability to use PromQL in CloudWatch enables teams to maintain consistent querying patterns across environments. Organizations using Prometheus for on-premises or Kubernetes monitoring can now apply the same query language to AWS-hosted resources.
Consider a team managing both on-premises Kubernetes clusters and Amazon EKS. With this integration, they can use the same PromQL queries to analyze metrics from both environments, reducing the learning curve and operational complexity.
High-Cardinality Applications
CloudWatch's support for up to 150 labels per metric makes it suitable for applications that generate high-cardinality metrics, such as e-commerce platforms with thousands of products or financial services with numerous transaction types.
For instance, an e-commerce company can track metrics with dimensions for product category, price range, customer segment, and geographic region, enabling granular analysis of user behavior without metric truncation.
Containerized Application Monitoring
The OpenTelemetry-based Container Insights for Amazon EKS provides enhanced visibility into containerized applications. Teams can collect additional metrics from open source collectors like cAdvisor and kube-state-metrics, alongside AWS-specific metrics, to gain comprehensive visibility into container performance and resource utilization.
Trade-offs: Considerations and Concerns
Cost Implications
While the service is free during the preview period, concerns have been raised about the potential costs of high-cardinality metrics in production. As Luc van Donkersgoed, principal engineer at PostNL, noted: "This is both very cool and potentially very expensive for high-cardinality metrics."
Organizations should carefully evaluate their metric volume and cardinality needs, especially for applications with thousands of services or unique identifiers. The cost structure for the general availability release will be critical in determining the long-term viability for high-cardinality use cases.
Vendor Lock-in Considerations
While OpenTelemetry provides protocol standardization, organizations should consider the potential for vendor lock-in when adopting CloudWatch as their primary observability platform. The automatic enrichment with AWS-specific metadata adds value but may create dependencies on AWS services.
For organizations with multi-cloud strategies, maintaining the ability to export telemetry data to other platforms remains important. AWS already supports the reverse scenario—delivering CloudWatch metrics to OpenTelemetry with metric streams—but organizations should evaluate their long-term observability architecture.
Operational Complexity
While the integration simplifies telemetry ingestion, organizations should still consider the operational complexity of managing OpenTelemetry collectors, especially for hybrid or multi-cloud environments. The collectors need to be properly configured, deployed, and monitored to ensure reliable telemetry delivery.
Teams should also consider the learning curve for engineers who may need to become familiar with both OpenTelemetry and CloudWatch's specific features and interfaces.
Implementation Considerations
For organizations considering adopting this preview, several implementation considerations should be kept in mind:
Collector Configuration: OpenTelemetry collectors will need to be configured to send metrics to CloudWatch's OTLP endpoint. Organizations should review the AWS documentation for specific configuration requirements.
Metric Cardinality Planning: While CloudWatch supports high-cardinality metrics, organizations should still plan their instrumentation strategy to avoid excessive cardinality that could impact performance and costs. This includes careful consideration of which dimensions to include in metrics.
Migration Strategy: Teams using Prometheus or other monitoring solutions should develop a migration strategy that considers both the technical aspects of the transition and the organizational changes required to adopt the new approach.
Security and Compliance: Organizations should ensure that the telemetry data sent to CloudWatch complies with their security and privacy requirements, particularly when dealing with sensitive application metrics.
Conclusion
Amazon CloudWatch's OpenTelemetry metrics support represents a significant step toward standardizing observability on open protocols while leveraging managed cloud services. The ability to send metrics, traces, and logs through a single protocol simplifies the observability stack, while PromQL support provides familiarity for teams already using Prometheus.
However, organizations should carefully evaluate the trade-offs, particularly regarding potential costs with high-cardinality metrics and the implications for vendor lock-in. As with any technology adoption, a thoughtful implementation strategy that considers both technical and operational factors will be key to realizing the full benefits of this integration.
As the observability landscape continues to evolve, the integration of open standards with managed services like CloudWatch will likely play an increasingly important role in helping organizations balance standardization with operational efficiency.
Comments
Please log in or register to join the discussion