Azure Monitor now ships native Service Level Indicators, error budgets, and burn-rate alerting as a generally available feature. For teams running multi-cloud observability, it changes the calculus on whether reliability tooling lives in the platform or in a third-party layer.
What changed
Microsoft has moved Service Level Indicators (SLIs) and Service Level Objectives (SLOs) in Azure Monitor from preview to general availability. The practical effect is that reliability measurement based on customer experience, rather than raw infrastructure signals, is now a first-class, supported capability inside the Azure platform.
The distinction matters because it reframes what "healthy" means. An SLI is a quantitative measure of how a service performs from the customer's point of view, latency on a checkout request, or the success rate of an API call, for example. An SLO is the target you hold that indicator to over a defined window. Azure Monitor refers to this target as a baseline. A virtual machine can report 100 percent uptime while customers experience timeouts from a slow dependency, and traditional infrastructure dashboards will happily show green the entire time. SLIs close that gap.
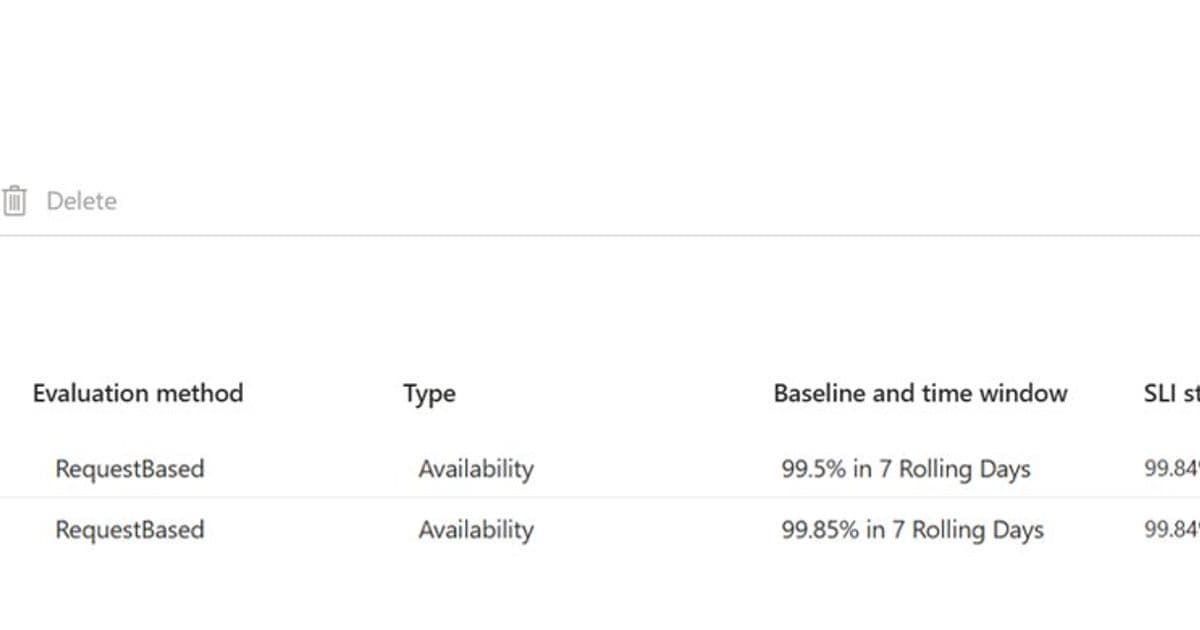
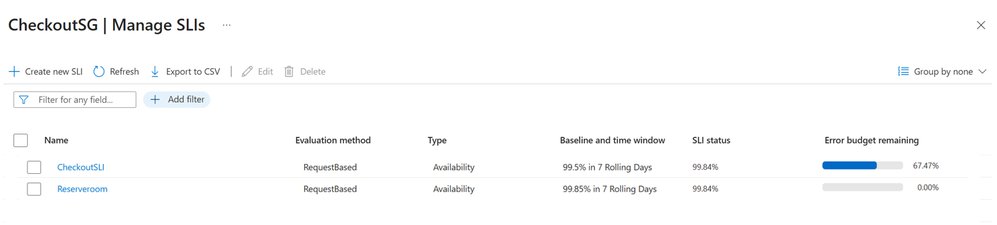
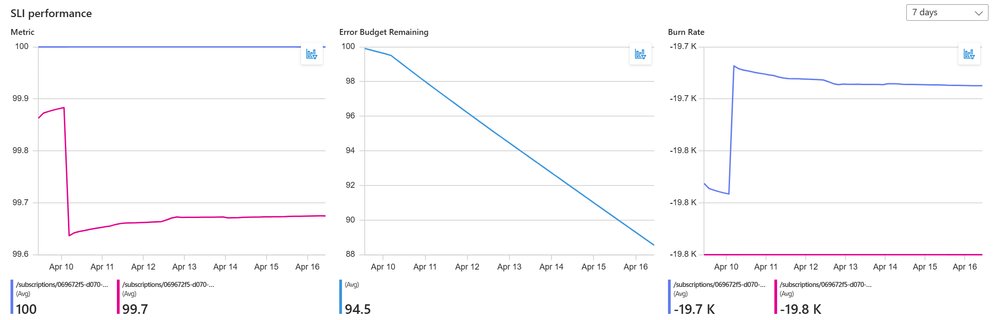
With GA, Azure Monitor folds SLI authoring, SLO tracking, error budgets, and burn rate based alerting into a single workflow. SLIs are defined at the Service Group level, a logical grouping that represents an application across multiple underlying resources, so the measurement follows the application rather than any one VM, container, or database. Evaluations run continuously against existing Azure Monitor metrics and land in your Azure Monitor Workspace, which then powers the error budget math, burn rate visualization, and alerting.

Provider comparison
This is Microsoft catching up to a pattern that Google and, to a lesser degree, AWS have offered for years, and the comparison is worth making carefully because the implementations differ in ways that affect cost and lock-in.
Google Cloud Operations has the most mature native SLO tooling of the three, which is unsurprising given that Google authored the SRE practices the whole industry copied. Cloud Monitoring lets you define SLIs against request-based or windows-based metrics, set rolling and calendar SLO windows, and configure burn rate alerts with the fast and slow burn multi-window approach straight out of the SRE workbook. There is no separate charge for the SLO feature itself; you pay for the underlying metric ingestion and retention.
AWS takes a more assembled approach. CloudWatch introduced Application Signals SLOs that compute attainment and error budgets, but historically AWS teams stitched reliability targets together from CloudWatch metric math, composite alarms, and custom dashboards. The newer Application Signals offering narrows the gap, though it leans heavily on the broader Application Signals instrumentation being in place, which carries its own per-signal pricing.
Azure's GA release now matches the core feature set: request-based and window-based evaluation, error budgets, and burn rate alerting. Its differentiator is the Service Group abstraction, which gives a cleaner logical boundary than tagging conventions, and its reliance on data you may already be collecting through Managed Prometheus or OpenTelemetry. If your telemetry already flows into an Azure Monitor Workspace, the marginal cost of turning on SLIs is small.
Pricing and the build-versus-buy question
For organizations standardized on a dedicated reliability platform, Datadog, Grafana Cloud, Nobl9, or Honeycomb among them, the native option forces a familiar decision. Third-party SLO tooling generally offers richer cross-cloud aggregation and a unified definition language that does not care whether the underlying signal came from AWS, Azure, or on-premises. That portability is the entire reason teams pay for it.
The native Azure path trades that portability for lower cost and tighter integration. You are not paying a separate vendor per monitored service, and the SLIs read directly from metrics already sitting in your workspace. The cost shows up as workspace ingestion and query volume rather than a per-SLO license. For a single-cloud Azure shop, that math usually favors the native tooling. For a genuinely multi-cloud estate, the calculation is murkier, because running SLO definitions in three different native systems reintroduces exactly the fragmentation a central observability layer was meant to solve.
The pragmatic middle path many consultants will recommend is to use OpenTelemetry as the collection standard regardless of where the SLO logic ultimately lives. Because Azure Monitor SLIs can be driven by OpenTelemetry data and Managed Prometheus, you keep your instrumentation vendor-neutral while choosing the evaluation engine per workload. That preserves the option to migrate SLO definitions to a third-party tool later without re-instrumenting applications.
Business impact
The immediate value is organizational rather than technical. Error budgets give engineering and product a shared, numerical vocabulary for the trade-off between shipping speed and stability. When the budget is healthy, teams ship. When burn rate spikes, the same data justifies slowing releases or pulling people onto an incident, and it does so without the usual argument about whether a problem is real. Burn rate alerting also cuts noise, because it fires on sustained customer-facing degradation rather than every transient infrastructure blip.
Getting started requires three things: a Service Group representing your application, application metrics flowing into an Azure Monitor Workspace through Managed Prometheus or OpenTelemetry, and a definition of which availability and latency indicators actually reflect customer experience. That last item is the hard part, and no platform GA solves it for you. The tooling is now table stakes across all three major clouds. The differentiation has moved to whether your team can articulate what reliable actually means to the people using your service.
For Azure-centric organizations that have been routing reliability data to an external platform purely for SLO computation, this release is a reason to revisit that spend. For multi-cloud teams, treat it as one more native capability to weigh against the cost of fragmentation, and standardize on OpenTelemetry so the decision stays reversible.
Comments
Please log in or register to join the discussion