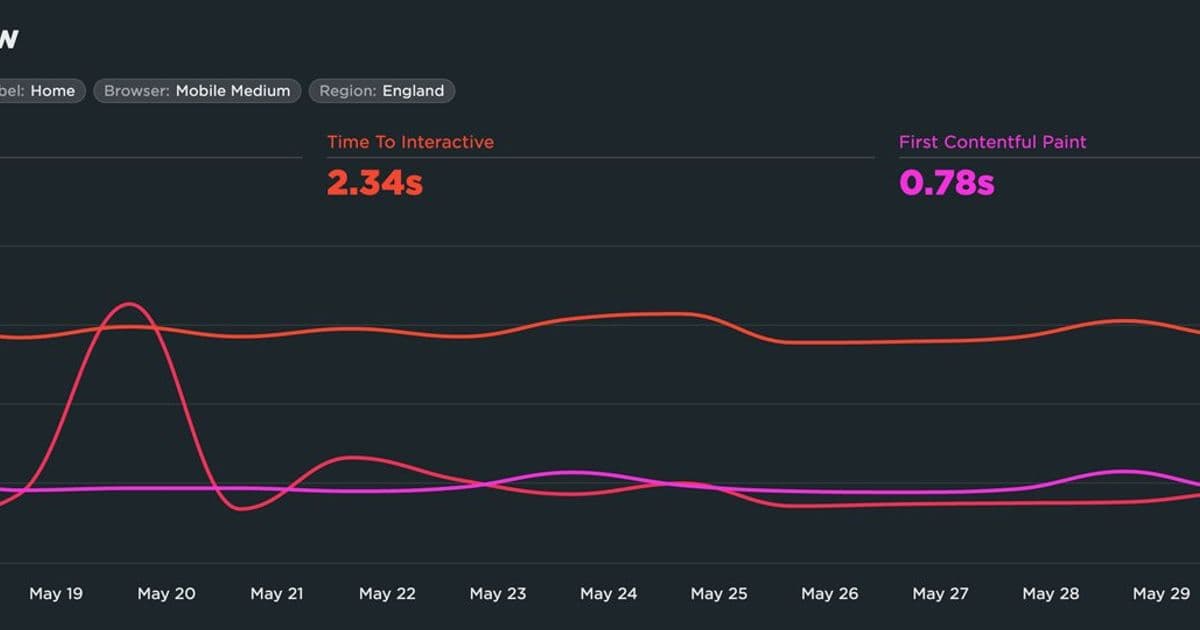
Harry Roberts explains why Total Blocking Time can appear to explode without any JavaScript change, introduces the “TBT Window” (the interval between First Contentful Paint and Time to Interactive) as the missing piece of context, and shows how network‑level tweaks such as an LCP preload can shift that window and inflate TBT. He argues for tooling that visualises the window alongside TBT to separate real blocking regressions from metric artefacts.
Front‑End’s Missing Metric: The TBT Window
1 June 2026 · Harry Roberts – CSS Wizardry
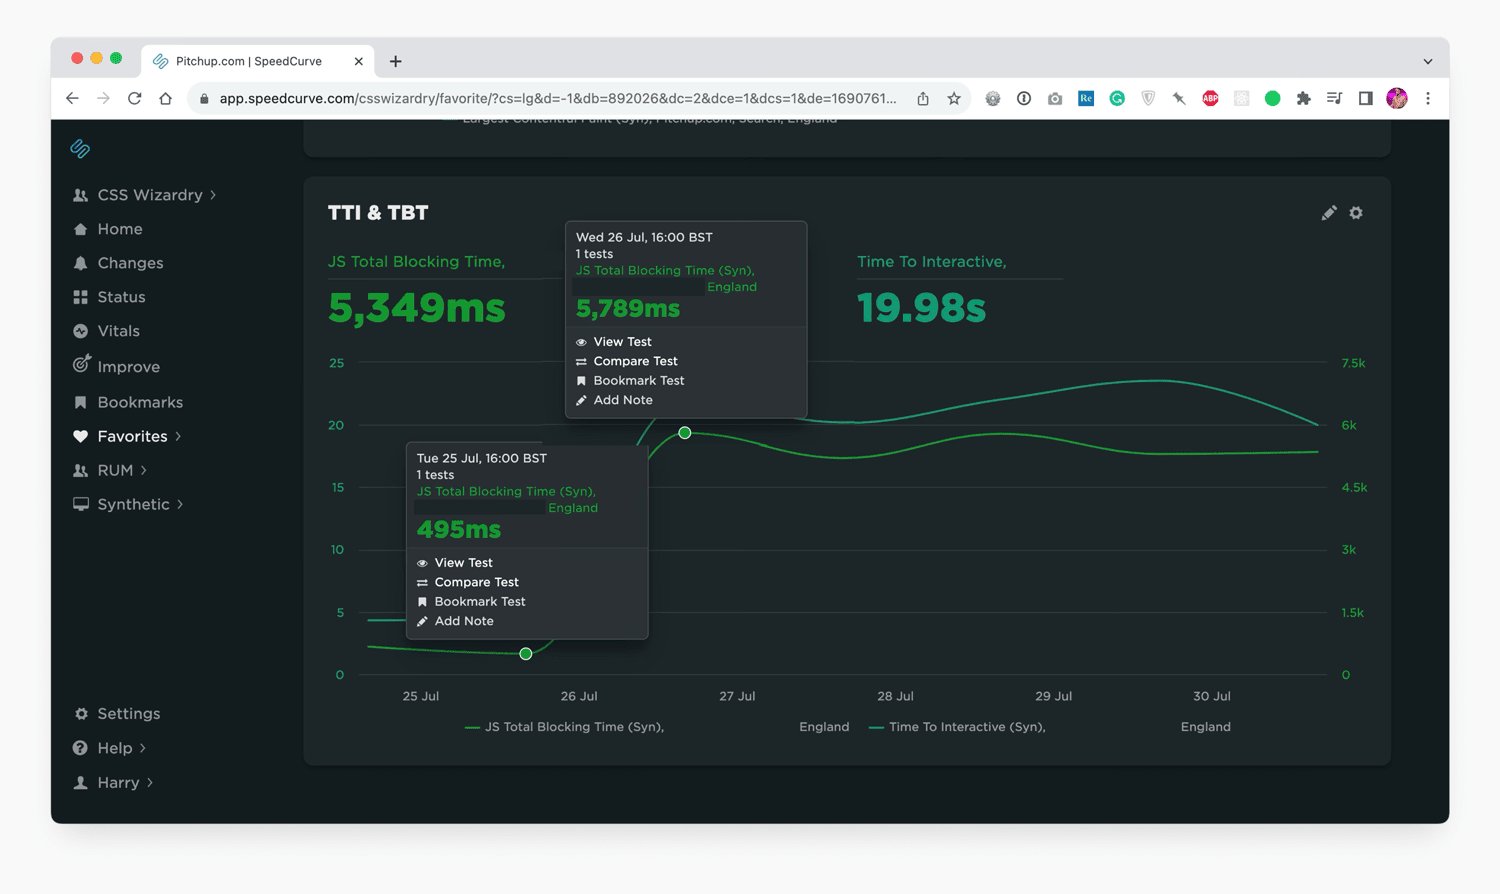
When a client’s SpeedCurve chart showed Total Blocking Time (TBT) jump from 495 ms to 5,789 ms, the instinctive reaction was to hunt for a JavaScript regression. Bundles were inspected, third‑party scripts audited, and tag managers scrutinised – all to no avail. The truth, as the investigation revealed, lay not in the code but in the definition of the metric itself. This is the story of the TBT Window, a simple yet overlooked interval that explains why TBT can swing dramatically without any change to the page’s work.
A quick refresher on TBT
- Total Blocking Time is a lab metric that quantifies how long the main thread is unavailable during page load. It looks at long tasks – any task longer than 50 ms – and counts only the portion beyond that threshold. A 70 ms task contributes 20 ms to TBT; a 250 ms task contributes 200 ms.
- Crucially, TBT is not an unbounded sum of every blocking period. It is bounded by two milestones:
- First Contentful Paint (FCP) – the moment the user first sees meaningful content.
- Time to Interactive (TTI) – the moment the page is considered reliably interactive.
- TBT therefore measures blocking work that occurs between FCP and TTI.
Why TTI matters even after its deprecation
Lighthouse removed TTI from the performance score in version 10, but the metric still underpins other scores, most notably TBT. TTI is calculated by:
- Starting at FCP.
- Searching forward for a quiet window of at least five seconds (no long tasks and no more than two in‑flight GET requests).
- Walking backward to the last long task before that quiet window; the end of that task is the TTI value.
Because TTI defines the upper bound of the TBT measurement window, any shift in TTI – whether caused by a new network request, a long‑task outlier, or a change in paint timing – instantly changes the amount of timeline that TBT can inspect.
The TBT Window defined
TBT Window = interval [FCP, TTI] during which blocking work is counted.
- If FCP moves earlier, the window opens sooner and tasks that previously fell before the window now contribute to TBT.
- If FCP moves later, the window shrinks and some tasks drop out of the count.
- If TTI moves earlier, the window closes sooner, cutting off late‑stage long tasks.
- If TTI moves later, the window expands, pulling in the tail of the load.
The key insight is that the long tasks themselves may be unchanged; only the duration of the window that the metric examines has altered.
A concrete regression
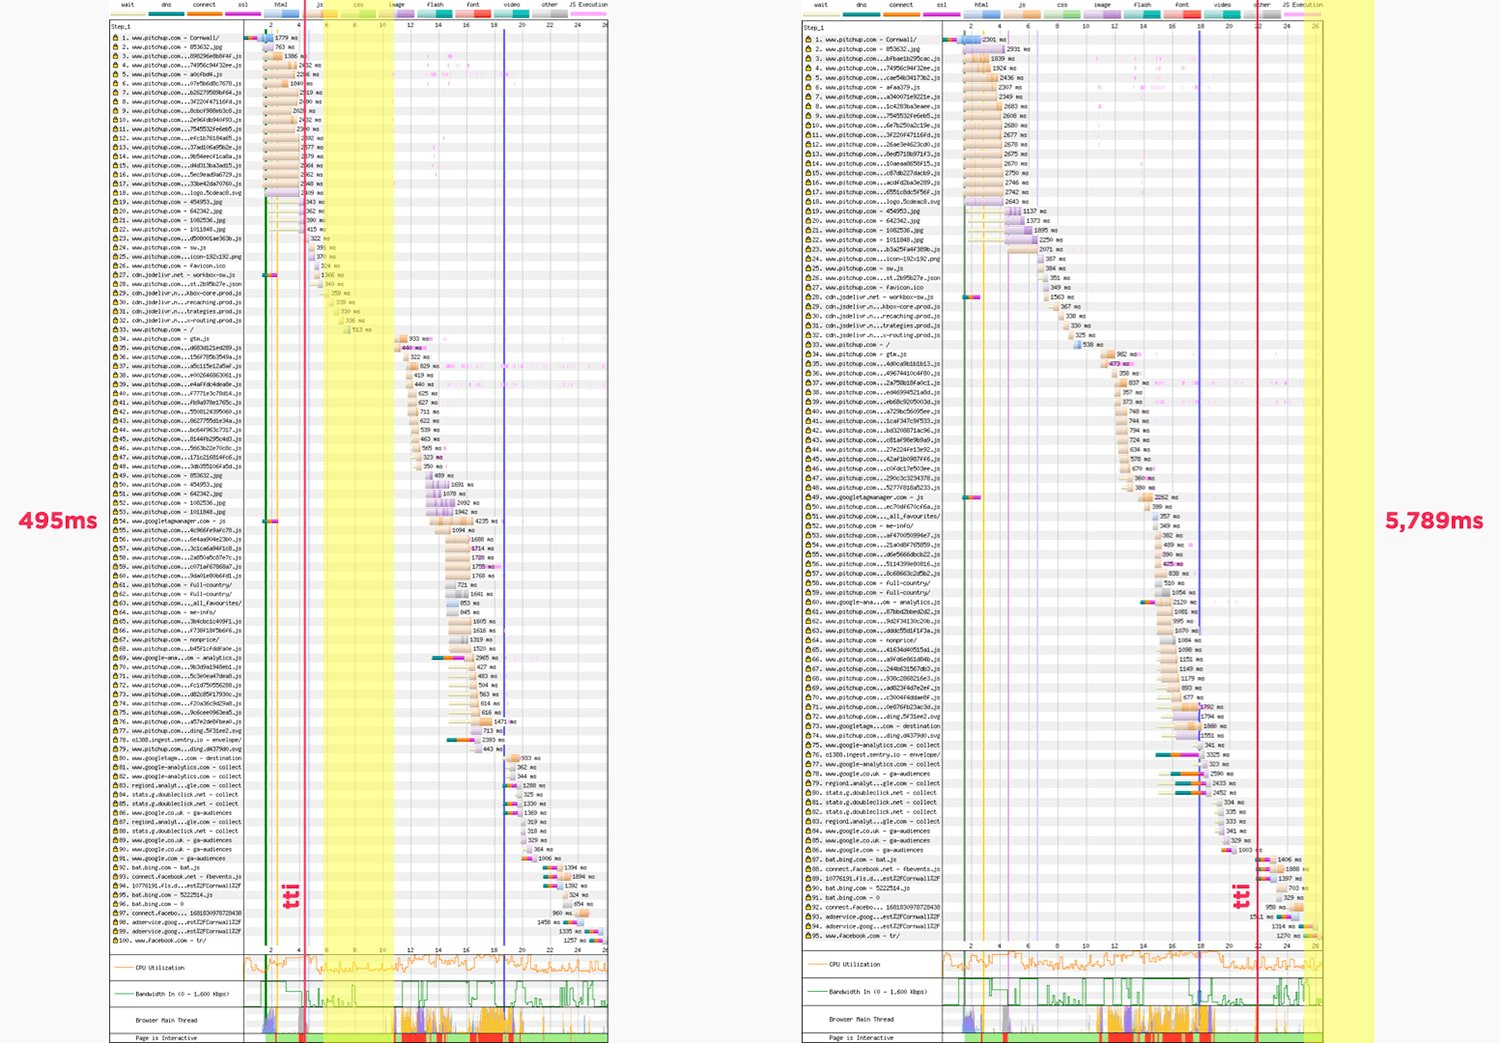
In the client case, the SpeedCurve chart showed a ten‑fold rise in TBT. The team first blamed JavaScript, but the waterfall traces told a different story:
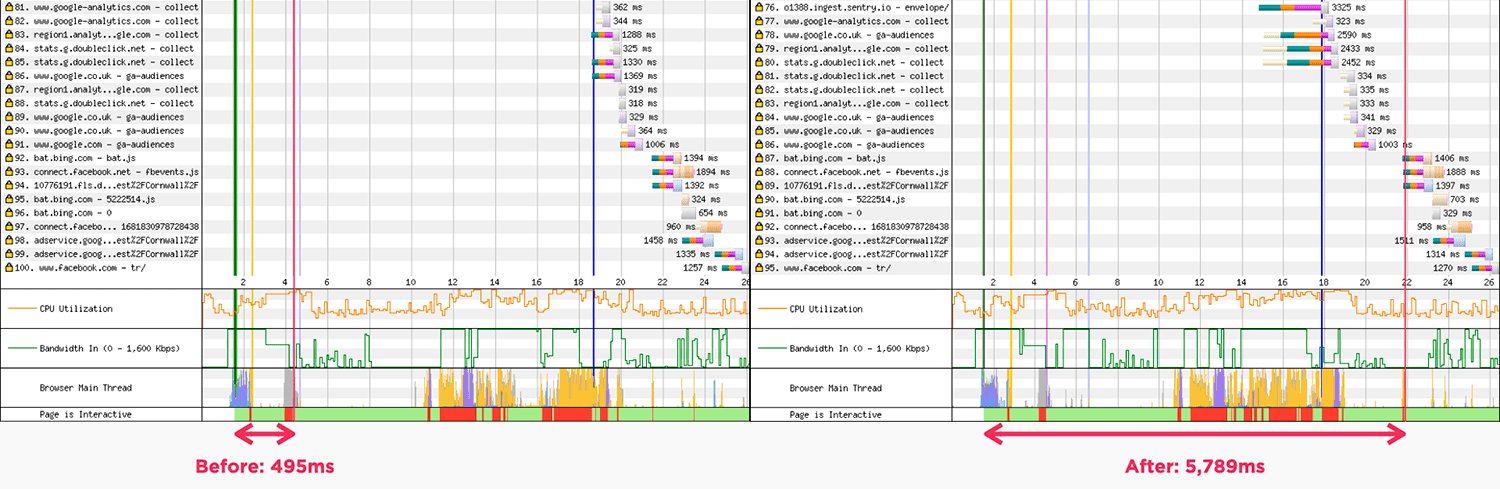
- The long‑task profile was virtually identical before and after the change.
- The quiet‑window marker (yellow) moved far later in the after‑run, pushing TTI out to nearly 20 seconds.
- Consequently, the TBT Window stretched across almost the entire waterfall, counting many tasks that were previously ignored.
The hidden catalyst: an LCP optimisation
The only concrete change between the two runs was a preload for the Largest Contentful Paint image. The preload succeeded in improving LCP, but it also introduced an extra in‑flight request. Because TTI’s quiet‑window definition allows at most two concurrent GET requests, the additional request prevented the window from being found early. TTI slipped later, the window widened, and TBT inflated.
This illustrates a classic metric‑interaction problem: an optimisation for one user‑visible metric (LCP) unintentionally harms another (TBT) by altering the underlying definition of the latter.
When does a larger window mask a real regression?
If the window expands because FCP or network quietness changes, the TBT rise may be a windowing artefact – the work itself is unchanged. If the window expands and the long‑task profile also shows more or slower tasks, the increase reflects a genuine regression – both more work and a larger window are at play.
Distinguishing these cases is essential because the remediation paths differ: a windowing artefact calls for a metric‑aware investigation, while a genuine regression demands code‑level optimisation.
Practical guidelines
- Plot the TBT Window alongside TBT. Most synthetic tools already know FCP and TTI; they can simply draw the interval between them.
- Treat TBT as a regression only when it diverges from TTI beyond a chosen threshold. If both move together, the change is likely window‑driven.
- When TBT spikes while the window stays flat, focus on reducing long‑task work (bundle size, third‑party scripts, hydration cost, etc.).
- When TBT improves while the window shrinks, verify that the improvement is not merely a result of a narrower measurement period.
A minimal dashboard could show three series – FCP, TTI, and TBT – with the area between FCP and TTI shaded to visualise the window. Tools such as SpeedCurve already allow custom series; DebugBear has recently added this visualisation, making it the first public implementation.
Closing thoughts
TBT remains a valuable lab metric for spotting main‑thread contention, but its reliance on the now‑retired TTI definition makes it vulnerable to non‑code influences. By exposing the TBT Window, developers gain the context needed to separate true performance regressions from metric artefacts, avoiding wasted time chasing JavaScript that never changed.
If you monitor TBT, start tracking the window today – the extra line on a chart can save hours of debugging and keep your optimisation efforts focused where they truly matter.
Harry Roberts is an independent web‑performance consultant. He helps companies find and fix site‑speed issues.
Comments
Please log in or register to join the discussion