
At GrafanaCON 2026, Grafana Labs unveiled a Kafka‑backed ingestion layer for Loki that cuts storage duplication and query latency, plus a new CLI called GCX that brings observability data directly into AI‑driven coding agents. The changes address long‑standing cost and operational concerns while extending Grafana’s reach into agentic development workflows.
Grafana Labs announced Grafana 13 at GrafanaCON 2026 in Barcelona, highlighting two major updates. First, the Loki logging system now uses Apache Kafka as a durability layer at the ingestion point. Second, the company released a public preview of GCX, a command‑line interface designed to surface Grafana Cloud data inside agentic development environments such as Claude Code, Cursor, and GitHub Copilot.
Loki’s Kafka‑backed ingestion
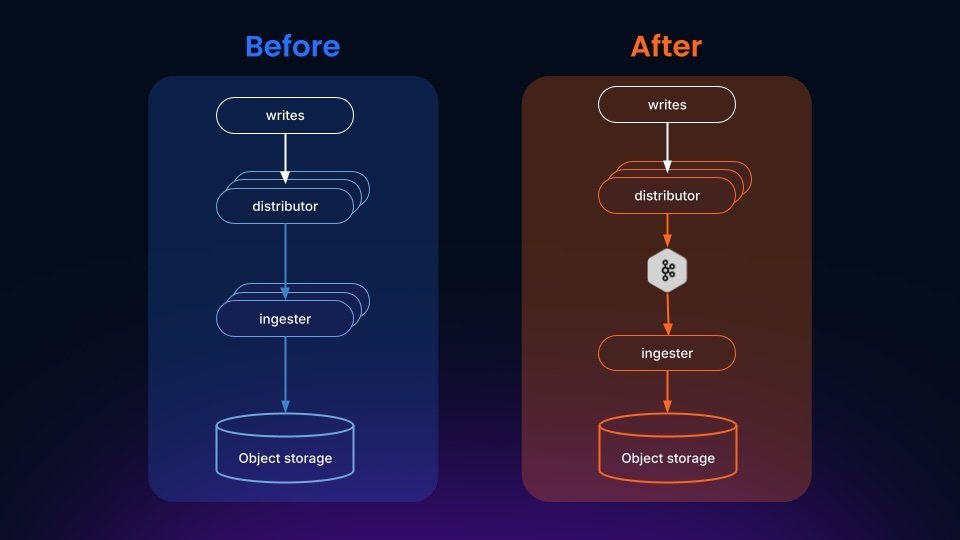
The original Loki design relied on replication at the ingesters: each log line was written to three ingesters, giving a replication factor of three. Deduplication depended on matching file names produced by ingesters covering the same time window. In practice, clock drift between ingesters caused file names to diverge, preventing deduplication. Internal metrics showed an average storage multiplier of 2.3× for every ingested line, inflating CPU, memory, network, and object‑storage costs, and requiring duplicate reconciliation at query time.
By inserting Kafka as a durable log buffer, each line is persisted once. Ingester processes then consume from Kafka topics, eliminating the need for triple writes. The replication factor effectively becomes one for the ingestion path. Grafana claims this change reduces stored data by up to 90 % and cuts query latency by a factor of ten for aggregated workloads, thanks to a redesigned query engine that works across Kafka partitions in parallel.
The trade‑off is an additional operational dependency. Loki’s original goal was to run with only object storage. The new architecture requires both object storage and a Kafka cluster for any distributed deployment. Single‑binary or home‑lab setups remain unaffected because they do not need replication; they can continue to use local disk or object storage alone.
GCX: bringing observability into the agentic loop
The second announcement, GCX, targets the friction engineers feel when moving between their editor and observability tools. Ward Bekker, who led the GCX effort, demonstrated a typical scenario: a synthetic monitoring check flags a failure in an e‑commerce order flow; Grafana Assistant performs automated root‑cause analysis; GCX pulls that analysis and the relevant source files into Claude Code; Claude Code suggests and applies a fix; GCX then queries the synthetic monitoring metric directly to confirm recovery, all without leaving the terminal.
GCX is released as a CLI because many engineers now spend most of their day inside agentic coding tools where command‑line interaction feels natural. Grafana Labs is also building a remote MCP server in parallel to serve users who prefer a service‑based integration. Both approaches aim to keep the feedback loop tight: detect, diagnose, fix, verify.

Broader Grafana 13 features
Beyond Loki and GCX, Grafana 13 introduces generally available dynamic dashboards, adds Git‑based workflow support for dashboard versioning, and expands the data‑source ecosystem to over 170 integrations. An AI Observability product is also in public preview, letting teams monitor LLM‑powered applications in real time.
Grafana 13 and the Loki Kafka‑backed ingestion are generally available today. GCX and the AI Observability solution remain in public preview within Grafana Cloud.
These updates reflect Grafana’s strategy to reduce operational overhead for logging at scale while embedding observability deeper into the developer’s workflow, especially as AI‑assisted coding becomes more prevalent.
Comments
Please log in or register to join the discussion