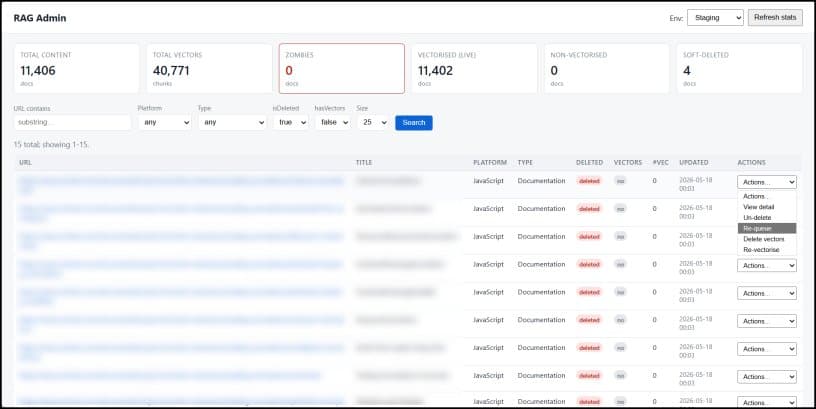
Jamie Maguire describes a lightweight .NET Minimal API tool that monitors and repairs a two‑index Retrieval‑Augmented Generation (RAG) architecture built on Elasticsearch and OpenAI embeddings. The admin panel surfaces zombie documents, synchronises metadata and vector indices, and provides one‑click re‑vectorisation, helping teams keep semantic search reliable as content evolves.
What changed
When a Retrieval‑Augmented Generation (RAG) pipeline moves from a proof‑of‑concept to production, the initial vectorisation step quickly becomes the easy part. Over time, documents are soft‑deleted, crawlers re‑process pages, and the vector index can fall out of step with the metadata store. The result is a growing set of zombie entries – vector chunks that reference content that no longer exists. Jamie Maguire’s recent post explains how he solved this problem by building a dedicated administration panel that runs locally, talks to two Elasticsearch indices, and uses OpenAI embeddings for on‑demand re‑vectorisation.
Provider comparison
| Feature | Custom .NET Minimal API (Maguire) | Kibana / Elastic UI | Postman / curl scripts |
|---|---|---|---|
| Scope | Focused on RAG health – dashboard, search, single‑click actions | General purpose data exploration – no RAG‑specific actions | Manual request construction – error‑prone for repetitive tasks |
| Pricing | Free – runs on existing .NET runtime and Elasticsearch cluster | Included with Elastic Cloud subscription; extra features may require paid tier | Free (client side) |
| Deployment | Localhost tool, no auth needed for dev environments | Web UI, requires Elastic credentials, may need proxy for internal clusters | Standalone CLI, no UI |
| Operational overhead | One binary, synchronous calls, explicit state changes | Requires learning Kibana query DSL, separate dashboards for each index | Scripts must be maintained, no visual feedback |
| Migration considerations | Works with any two‑index layout; only mapping inspection is needed | Needs index patterns and saved searches to be recreated | Requires updating each curl command when mappings change |
The custom tool wins when the organization needs rapid, repeatable fixes for a specific two‑index RAG pattern. Kibana offers powerful visualisation but lacks the one‑click "delete zombie vectors" workflow. Postman is great for ad‑hoc queries but quickly becomes cumbersome for routine maintenance.
Business impact
Immediate operational savings
- Reduced manual effort – Instead of issuing a series of
_delete_by_queryand update calls, an operator can clear all zombie vectors with a single button press. Maguire reports a five‑minute turnaround that would otherwise consume hours of debugging. - Lower error rate – Synchronous API calls guarantee that each action is completed before the next begins, eliminating race conditions that often appear in scripted curl pipelines.
Long‑term data quality
- Consistent retrieval – By ensuring that every document’s vector chunks are generated with the same paragraph‑aware chunker used in production, the relevance of semantic search results remains stable.
- Visibility into pipeline health – The dashboard surface metrics such as total documents, vectorised vs. non‑vectorised, and zombie count. Teams can set internal SLAs (e.g., zombie count < 1 % of total) and monitor compliance.
Migration path for existing teams
- Map current indices – Run the tool’s startup routine to capture field names (e.g.,
uRL.keyword) and confirm mapping compatibility. - Pilot on staging – Switch the
EnvironmentManagerto a staging cluster, verify that re‑vectorisation produces identical embeddings to the production pipeline. - Roll out to production – Enable the production mode, perform a one‑off cleanup of existing zombies, then adopt the dashboard for ongoing health checks.
Key takeaways for cloud‑native RAG deployments
- Separate lifecycles demand separate stores – Splitting content metadata and vector chunks into two indices simplifies cleanup but introduces drift; an admin console is a pragmatic mitigation.
- Automation should be visible – A lightweight UI that surfaces counts and provides confirmation dialogs balances speed with safety, especially when operating on production clusters.
- Consistent chunking is non‑negotiable – Any divergence between ingestion and admin‑tool chunking leads to mismatched embeddings and degraded search quality.
- Batch Elasticsearch calls matter – Replacing per‑row count queries with a single
_msearchreduced page load time by roughly 80 % in Maguire’s implementation.
“If you are running a similar two‑index RAG architecture and finding that Kibana, Postman or curl commands is becoming unwieldy, I would encourage you to build something similar.” – Jamie Maguire
For teams looking to replicate this approach, the source code can be adapted from the minimal API pattern described in the article. The core concepts—environment switching, mapping introspection, and synchronized chunking—are portable across cloud providers, whether you host Elasticsearch on AWS, Azure, or a managed Elastic Cloud offering.
Image illustrating the admin dashboard layout 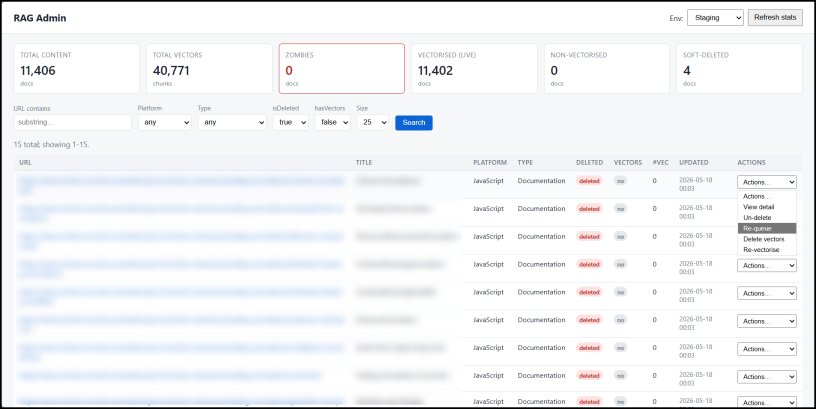
Further reading
Comments
Please log in or register to join the discussion