Since early 2019, recent college graduates have slipped from a long‑standing employment advantage to the highest unemployment rate of any major demographic, a trend driven by remote‑work dynamics, AI exposure, and a swelling supply of degrees.
New U.S. college grads now have higher unemployment than the average worker
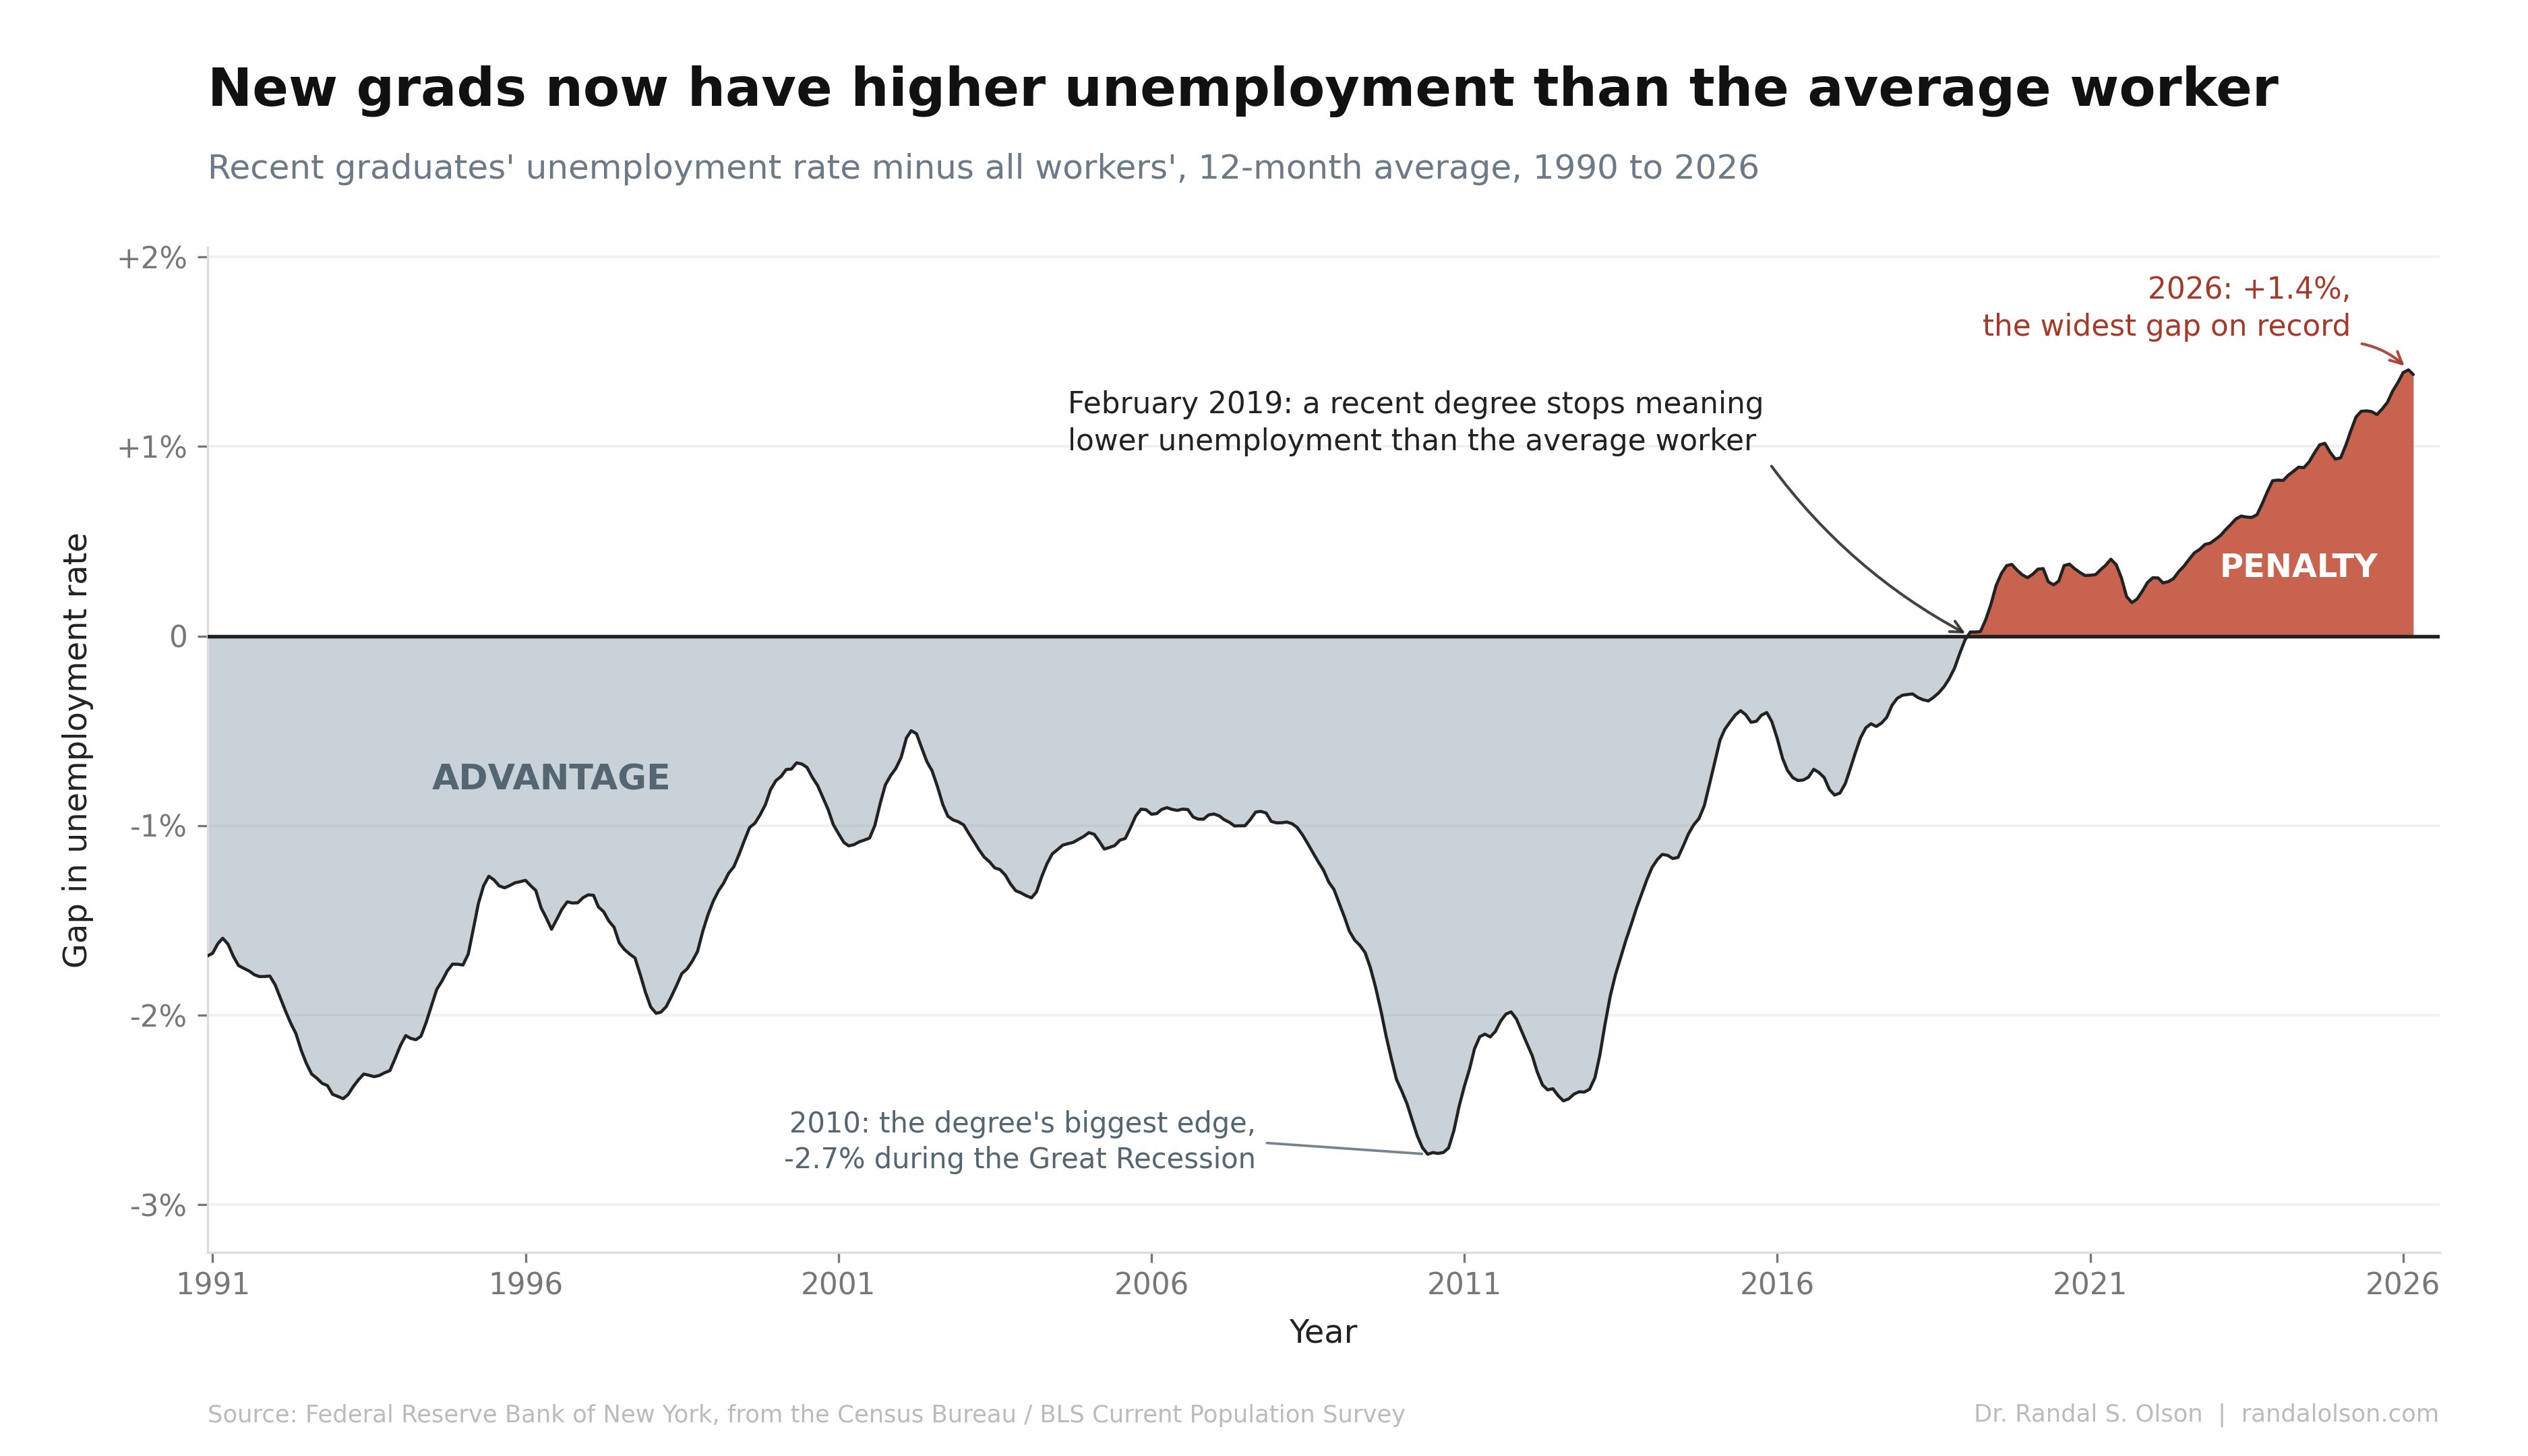
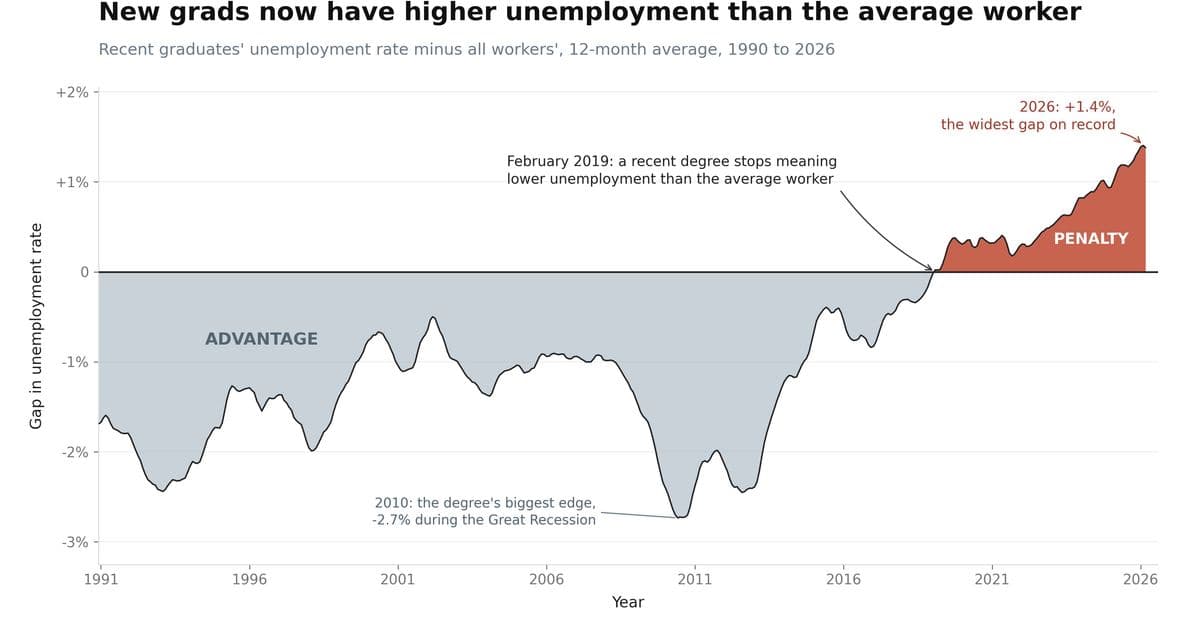
A fresh bachelor’s degree used to act like a modest safety net in the labor market. For decades, new graduates enjoyed lower unemployment than the broader workforce, even during recessions. By early 2026 that cushion has vanished – recent grads are now unemployed at 5.6 %, compared with 4.2 % for all workers, the widest gap on record.
The problem: a disappearing edge
- Historical advantage – From the early 2000s through the Great Recession, the unemployment gap between recent grads and the overall labor force was negative. In 2010, graduates were about 7 % unemployed while the economy-wide rate hovered near 10 %.
- Turning point – In February 2019 the gap crossed zero. Since then the 12‑month moving average has stayed positive, meaning new graduates are now worse off than the average worker.
- Underemployment – Even among those who are employed, roughly 41 % are in roles that do not require a degree, indicating a broader mismatch between education and job quality.
Funding and traction of the analysis
The chart that visualizes this trend was generated by an AI agent and evaluated with the Tufte Test, a data‑visualisation quality metric from Goodeye Labs. The underlying data come from the Federal Reserve Bank of New York’s Labor Market for Recent College Graduates series, which aggregates the U.S. Census Bureau and BLS Current Population Survey.
- Dataset download: Recent‑grad unemployment CSV (GitHub)
- Tufte Test demo: Try it yourself at the Goodeye Tufte Test page.
Why it matters now
Remote work as a catalyst
The New York Fed’s June 2026 paper attributes about 64 % of the rise in young‑grad unemployment to the expansion of remote work. Employers cite difficulty mentoring inexperienced hires when teams are distributed, leading them to favor candidates with proven on‑site experience.
AI exposure adds pressure
Stanford researchers report that early‑career workers (ages 22‑25) in jobs with high AI exposure saw a 16 % employment decline since late 2022, even after controlling for remote‑friendly roles. The effect is most pronounced in technology‑heavy fields where automation can replace routine entry‑level tasks.
Supply‑demand imbalance in tech degrees
Computer‑science graduates now face some of the highest unemployment rates among majors. The number of CS degrees awarded has more than doubled over the past decade, while the pool of entry‑level positions has contracted, creating a classic oversupply problem.
The broader picture
- Older degree‑holders (25 + years old) enjoy a healthy 2.8 % unemployment rate (April 2026, BLS), well below the high‑school‑only cohort.
- Non‑college young workers sit at 7.2 % unemployment, still higher than recent grads, so a degree remains valuable relative to no degree.
- The lifetime return on a bachelor’s remains near 12.5 % according to the New York Fed, indicating that the credential still pays off over a career, even if the early‑career boost has faded.
What’s next?
Economists are still debating the relative weight of remote‑work versus AI. Policy responses could include:
- Targeted apprenticeship programs that provide remote mentorship structures.
- Curriculum updates aligning degree output with emerging skill gaps, especially in AI‑augmented roles.
- Labor‑market information campaigns to help students gauge realistic entry‑level prospects before committing to costly programs.
How the chart was built
The visualization was produced by an autonomous AI agent trained to follow the Tufte Test guidelines, ensuring minimal chartjunk and clear data‑ink ratio. The agent fetched the raw series, performed cleaning (removing outliers, aligning age brackets), and plotted the difference between recent‑grad unemployment and the all‑workers rate. The final chart is available for download in the linked repository.
*For more on the methodology, see the Goodeye Labs blog post.*
Comments
Please log in or register to join the discussion