Visual Capitalist's Voronoi app reveals how immigration and history shape America's language landscape through detailed state-by-state mapping of non-dominant languages.
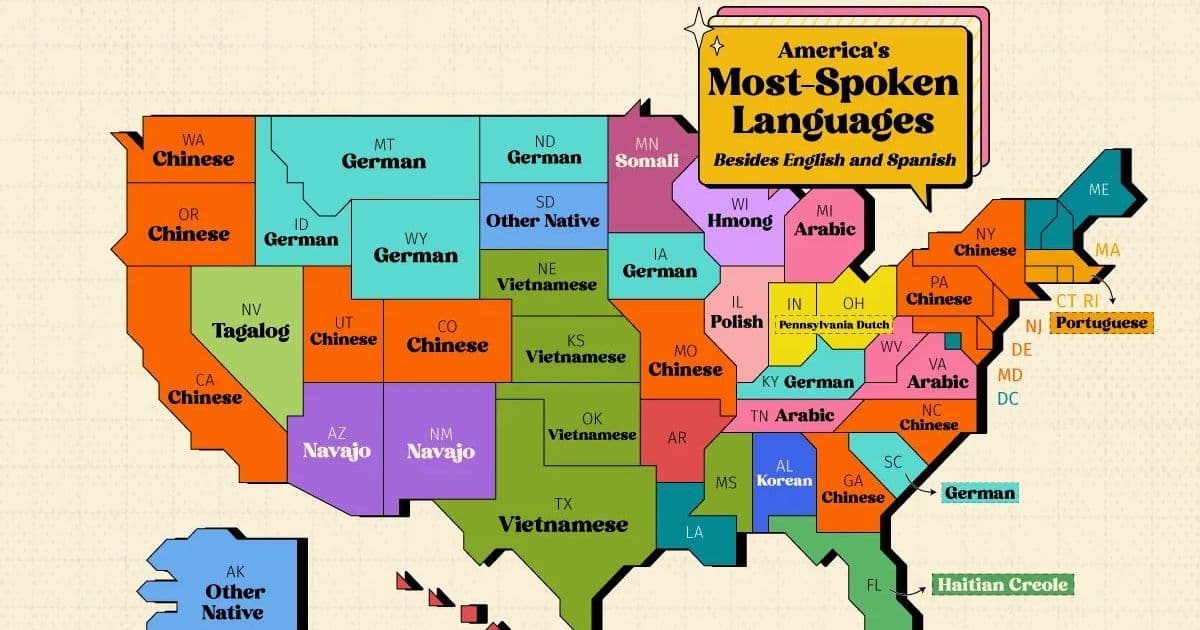
America's linguistic map looks remarkably different once English and Spanish are removed, according to new visualization data from Visual Capitalist's Voronoi app. The mapping project, based on U.S. Census Bureau American Community Survey data from 2020-2024, reveals the most-spoken language in each state beyond the two dominant languages, offering insights into how immigration patterns, Indigenous communities, and historical settlement continue to shape the country's cultural fabric.
The Voronoi app serves as a platform for data-driven visualizations that make complex demographic information accessible and engaging. The language mapping project represents one of many data-driven charts available through the free iOS and Android application, which aggregates visualizations from trusted sources across various domains.
Chinese Dominates Coastal and Tech-Hub States
Chinese emerges as the most spoken non-English, non-Spanish language across an impressive 13 states, giving it the widest geographic footprint of any language on the map. This concentration appears particularly pronounced in coastal states and fast-growing Sun Belt economies with substantial technology and business sectors.
California alone hosts more than 1.2 million Chinese speakers, while New York contains over 600,000, reflecting both modern immigration patterns and more than 150 years of Chinese-American settlement history dating back to the 19th century. The states where Chinese dominates include California, Colorado, Delaware, Georgia, Maryland, Missouri, New Jersey, New York, North Carolina, Oregon, and others.
"The presence of Chinese in these tech and business centers isn't just recent immigration," explains Visual Capitalist founder and CEO Jeff Desjardins. "It represents a century and a half of community building, from early laborers to today's tech entrepreneurs and students."
German's Historic Footprint Remains Visible
Despite the passage of time, German maintains a prominent presence across several Plains and Mountain West states, including Montana, Wyoming, Idaho, Iowa, and North Dakota. This linguistic legacy reflects the massive wave of German immigration during the late 1800s, when German briefly became the country's largest non-English language.
That influence declined sharply following anti-German sentiment during World War I and immigration restrictions introduced in the 1920s. Nevertheless, the endurance of German in these regions demonstrates how language can persist as a cultural marker long after the initial immigration waves have diminished.
Regional Language Clusters Reflect Migration Patterns
Beyond Chinese and German, the visualization reveals several distinct regional language corridors across the United States, each telling a story of migration and cultural exchange:
- French remains prominent in Maine, Vermont, New Hampshire, Louisiana, and Washington, D.C., reflecting both Quebec-border heritage and Francophone migration patterns
- Vietnamese leads across Texas, Oklahoma, Nebraska, Kansas, and Mississippi, indicating significant Vietnamese refugee communities and subsequent generations
- Portuguese ranks first among non-English, non-Spanish languages in Massachusetts, Rhode Island, and Connecticut, showing the impact of Brazilian and Portuguese immigration
- Navajo remains the leading language category in Arizona and New Mexico, highlighting the enduring presence of Indigenous communities in the Southwest
- Alaska and South Dakota also stand out for their large populations speaking Indigenous North American languages
"These regional clusters aren't random," notes Desjardins. "They represent the stories of people who came to America, whether by choice or by force, and established communities that maintained their linguistic heritage across generations."
The Voronoi App as a Data Discovery Platform
The language mapping visualization represents one of many data-driven charts available through the Voronoi app, which positions itself as a discovery platform for complex information. The application aggregates visualizations from trusted sources across various domains, from demographics and economics to environment and technology.
"We built Voronoi to make data more accessible and engaging," Desjardins explains. "In an era of information overload, well-designed visualizations can transform complex datasets into meaningful insights that anyone can understand."
The app's free availability on both iOS and Android platforms aims to democratize access to high-quality data visualization, removing barriers to understanding the trends and patterns that shape our world.
Implications for America's Cultural Landscape
The visualization offers more than just interesting facts—it provides context for understanding America's evolving cultural identity. The persistence of Indigenous languages alongside newer immigrant communities demonstrates the country's complex relationship with both its original inhabitants and newer arrivals.
"This mapping helps us see America not as a monolithic culture but as a tapestry of linguistic traditions," observes Desjardins. "Each language cluster represents a community that has maintained its identity while contributing to the broader American experience."
As immigration continues to shape America's demographic profile, visualizations like this one offer a framework for understanding how cultural exchange and preservation occur simultaneously, creating the diverse linguistic landscape that characterizes the United States today.
Comments
Please log in or register to join the discussion