
Airbnb engineers detail their production-tested migration from StatsD to a modern metrics pipeline using OpenTelemetry and vmagent, handling over 100 million samples per second while reducing costs by an order of magnitude.
Building a High-Volume Metrics Pipeline with OpenTelemetry and vmagent
When migrating monitoring systems, the conventional wisdom is to frontload the work of collecting all metrics first. This approach exposes bottlenecks at full write scale and unblocks migration of assets requiring real data for validation, such as dashboards and alerts. For Airbnb's observability team, this strategy presented significant technical challenges as they transitioned from a StatsD-based system to a modern, Prometheus-based pipeline.

The Migration Challenge
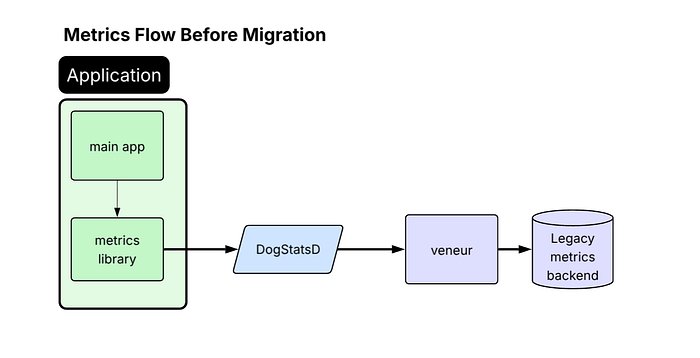
Airbnb's original services relied on the StatsD protocol, with a Veneur sidecar collecting and forwarding metrics to their vendor. This architecture, while functional, limited their ability to leverage modern observability features and created dependency on a proprietary solution. The migration required answering several critical questions:
- Where should metrics be forked during transition?
- Should they fully adopt OpenTelemetry?
- How would their metrics perform with Prometheus?
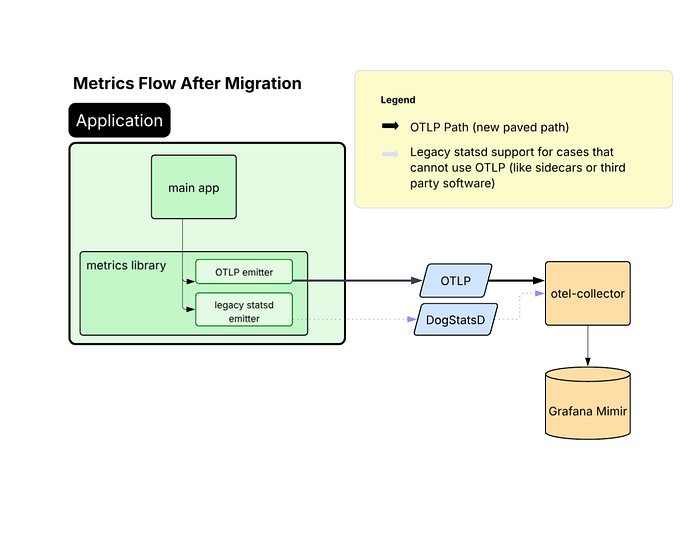
The team defined a clear strategy for supported instrumentation protocols: OpenTelemetry Protocol (OTLP) for internal services, Prometheus for open-source workloads, and StatsD as a fallback for legacy applications. This led them to adopt the vendor-neutral OpenTelemetry Collector (OTel Collector) as the centerpiece of their new architecture.
Dual-Write Migration Strategy
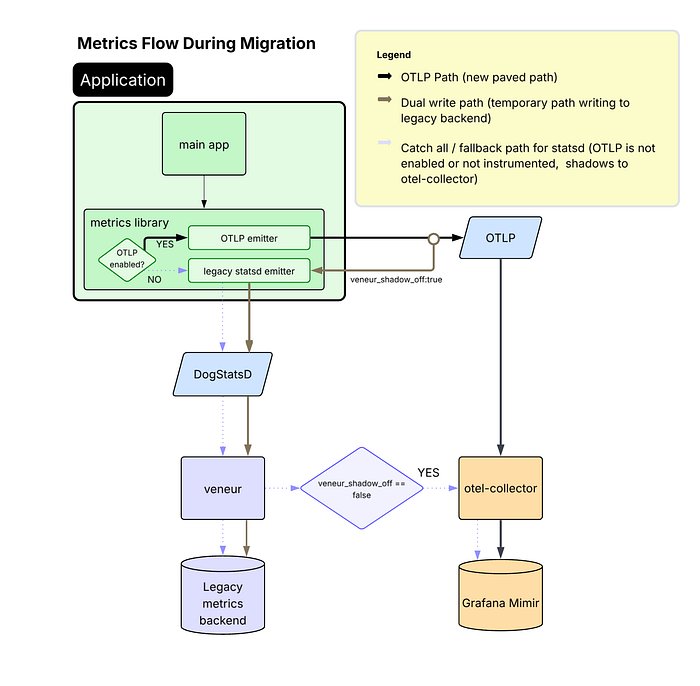
Approximately 40% of Airbnb's services use a shared platform-maintained metrics library, which became the logical starting point for OTLP adoption. By enabling this library to dual-emit metrics—sending StatsD to the existing pipeline and OTLP to the new OTel Collector—the team achieved broad migration progress with minimal friction.
"This dual-write approach allowed us to maintain service continuity while gradually transitioning to our new infrastructure," explains Eugene Ma, the lead engineer on the project. "We could validate that our new pipeline handled production volumes before fully committing to the migration."
The benefits of moving to OTLP became quickly apparent:
- Performance improvement: JVM profiling showed CPU time spent on metrics processing dropped from 10% to under 1% of total CPU samples in production.
- Enhanced reliability: OTLP provides greater reliability than StatsD, which relies on UDP and is more vulnerable to packet loss under high throughput.
- Native Prometheus support: Emitting OTLP natively removed the need for an intermediate StatsD-to-OTLP translation step and enabled Prometheus-native capabilities like exponential histograms with full fidelity.
- Future-proofing: As a CNCF-sponsored, vendor-neutral protocol, OTLP positions the company to support future observability use cases without protocol barriers.
Addressing High-Cardinality Challenges
While most services handled the dual-write mode without issues, Airbnb's highest-volume metric emitters—many of which are also among their most critical services—experienced significant performance regressions after enabling OTLP. These services suffered from memory pressure, increased garbage collection activity, and heap growth.
Through investigation, the team connected these issues to the extremely high-cardinality metrics being emitted—on the order of 10,000+ samples per second per instance. To mitigate this regression, they updated their common metrics library configuration to use delta temporality (AggregationTemporalitySelector.deltaPreferred()) for select services.
"Delta temporality reduces the in-process memory burden because it avoids retaining full state for all metric-label combinations between exports," Ma notes. "However, we found this was only necessary for services emitting extremely high metric volume, so we left the rest using the default cumulative mode."
The trade-off with delta metrics is that unexpected failures result in visible gaps in the data, whereas with cumulative metrics, those same failures typically appear as a larger jump between data points. "This was an acceptable trade-off for reduced memory usage and improved stability in our highest-volume services," Ma adds.
Implementing vmagent for Streaming Aggregation
To keep costs under control, Airbnb's previous pipeline used an internal fork of Veneur to aggregate away instance-level labels (e.g., pod, hostname) rather than submitting raw metrics directly to their vendor. In their Prometheus-based world, they needed a similar aggregation step.
After evaluating several options—including continuing with Veneur, using Prometheus recording rules, trying m3aggregator, or considering the OpenTelemetry Collector—they selected vmagent from VictoriaMetrics for several compelling reasons:
- Supports streaming aggregation for Prometheus metrics
- Provides sharding capabilities for horizontal scaling
- Offers excellent documentation that made setup straightforward
- Has a small codebase (~10K LOC), making it easy to understand and modify
The team implemented a two-layer vmagent architecture:
- Routers: Stateless components that shard metrics by consistently hashing all labels except those to be aggregated away (e.g., "pod", "host")
- Aggregators: Components that perform the actual aggregation (summing counters) and maintain in-memory state of outputs
Each router receives a static list of aggregator hostnames. "Kubernetes gives StatefulSet pods stable network identity, so this simple approach avoids additional service discovery dependencies and keeps metrics sharding consistent between pods," Ma explains.
The team made several internal customizations to support Airbnb's metrics environment, including native histogram support and Mimir-style multitenancy. More generic changes were contributed back upstream to the vmagent project.
The Sparse Counters Problem
After migrating to their new Prometheus-based metrics pipeline, the team noticed that PromQL queries over certain counters were consistently undercounting compared to their previous vendor. The root cause lay in how Prometheus computes rates of change from cumulative counters.
"In a StatsD monitoring system, a data point measures the delta observed during a flush window, typically 10 seconds," Ma explains. "In Prometheus, a data point measures the cumulative count starting from zero. When you use rate() or increase() to derive deltas, there's an edge case: when a counter is created, it may also be incremented at the same time."
Consider a counter that increments once and resets (due to pod restart) before it can increment again. Each time the counter resets, that increment is lost before PromQL's rate() function has a chance to derive a delta.
This problem particularly affected Airbnb's systems, which tend to generate many low-rate counters with high dimensionality. "A counter tracking requests per currency per user per region might see any given data series increment only a handful of times a day, and these updates can be lost due to the issue with rate()" Ma notes. "Yet, these were often critical metrics that product teams needed to monitor accurately."
Solution: Zero Injection
After considering several rejected solutions—including pre-initializing all counters to zero, asking teams to use logs for exact counts, or emitting gauges instead of counters—the team implemented a transparent "zero injection" technique.
"Our aggregation tier was already processing all our metrics in a centralized location, so it was the perfect spot to implement the change," Ma explains. "When we flush an aggregated count for the first time, we flush a zero instead of the actual running total."
By injecting this synthetic zero, all counters are implicitly initialized to zero to match Prometheus counter semantics. The delayed flush ensures the zero's timestamp doesn't conflict with any previous samples. The only downside is that the initial increment will lag by one flush interval, which isn't significant in practice.
"This approach required minimal changes to vmagent, kept the fix invisible to end users, and solved the problem at the source rather than papering over it downstream," Ma concludes.
Results and Impact
The migration achieved impressive results:
- Single production cluster scaled to hundreds of aggregators
- Ingestion of over 100 million samples per second
- Overall cost reduction by an order of magnitude
- Maintained data accuracy while improving performance
"Our work demonstrates a practical, production-tested blueprint for migrating a massive, high-volume metrics pipeline to modern, open-source standards such as OpenTelemetry and Prometheus, all while maintaining data accuracy and cost efficiency," Ma summarizes. "The centralized aggregation tier has also become a powerful tool for other types of transformations, such as dropping problematic metrics when users deploy bad instrumentation changes or temporarily emitting raw metrics on demand."
This migration represents a significant technical achievement for Airbnb, showcasing how the company is investing in its observability infrastructure to support continued growth and maintain the reliability that millions of users depend on.
Comments
Please log in or register to join the discussion