
Air‑quality monitors are becoming ubiquitous, yet a swarm of misconceptions about sensor accuracy, calibration, and data interpretation persist. By dissecting common myths—from the illusion of precision in displayed numbers to the pitfalls of cross‑sensitivity—this article equips developers and engineers with the knowledge to evaluate and deploy reliable monitoring solutions.

The Rise of Misconceptions
In the past year, forums, support tickets, and even YouTube reviews have repeatedly surfaced the same set of myths about air‑quality monitors. These misunderstandings are not just harmless trivia; they shape how users trust data, how manufacturers design firmware, and ultimately how public health decisions are informed.
The source of the problem lies in a mismatch between the sophistication of modern sensor hardware and the transparency (or lack thereof) provided by most consumer‑grade devices.
Myth 1: A Displayed Number Means Accuracy
When a device shows 17 µg/m³ or 842 ppm, the number feels authoritative. In reality, the figure is the product of:
- Hardware – the raw sensor output.
- Firmware – filtering, smoothing, and averaging algorithms.
- Calibration – factory or custom curves applied to translate raw data into a meaningful unit.
Low‑cost VOC sensors are a prime example. They typically report a ppb value derived from an index that reflects broad chemical reactivity, not a true concentration of a specific compound. Without disclosed calibration data, users cannot judge the validity of the reading.
“A ‘VOC ppb’ value on a typical low‑cost monitor may have no relationship to the real concentration at all.” – AirGradient blog, 2025.
Myth 2: Manufacturers Test Their Sensors Thoroughly
Most consumer monitors rely on pre‑calibrated modules from a handful of suppliers (e.g., Plantower, Cubic, Sensirion). These modules are often treated as black boxes; the calibration method, reference aerosol, and environmental assumptions remain undisclosed. Moreover, many brands outsource assembly to OEMs that perform minimal verification beyond power‑on checks.
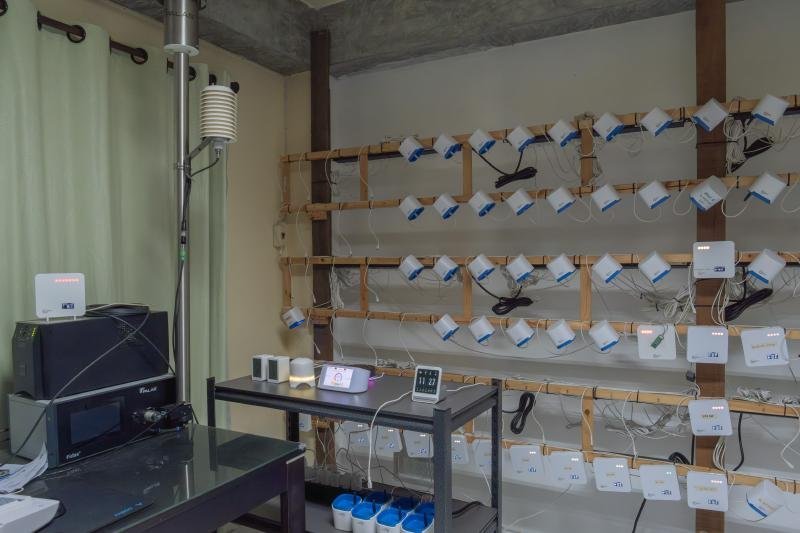
Only a minority of companies, including AirGradient, conduct side‑by‑side validation against reference instruments and apply individual sensor calibrations. This rigorous approach is what separates a truly reliable device from a “plug‑and‑play” gadget.
Myth 3: PM₂.₅ Numbers Are Directly Comparable
PM₂.₅ is a category, not a single pollutant. It includes soot, wildfire smoke, sea salt, fungal spores, brake dust, and more. Each particle type scatters light differently and carries distinct health risks.
Optical PM sensors infer mass from light scattering, so their calibration is optimized for a specific aerosol. A calibration tuned for incense smoke will misreport dust or wildfire smoke. Even if the numeric value is technically correct, the health implications can vary wildly.
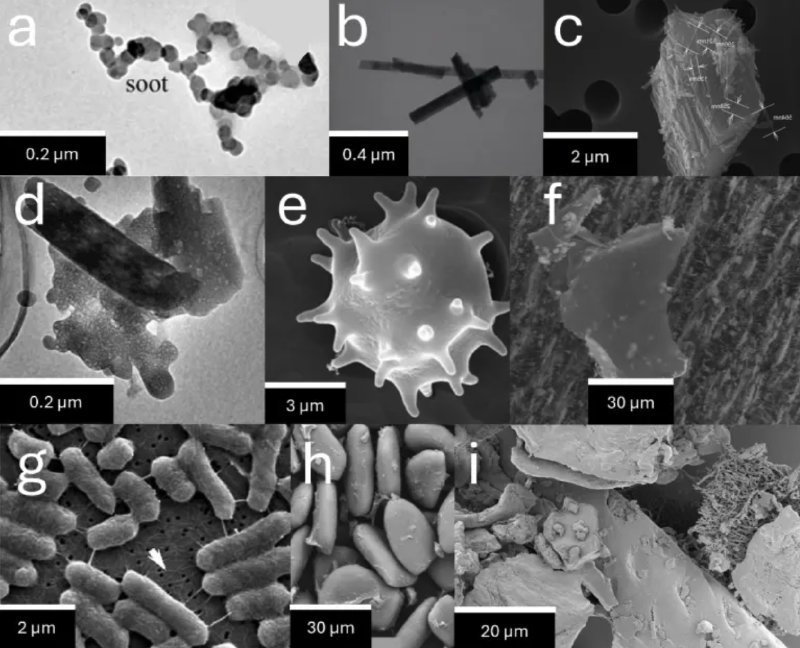
“The same mass concentration can have very different health implications.” – AirGradient blog, 2025.
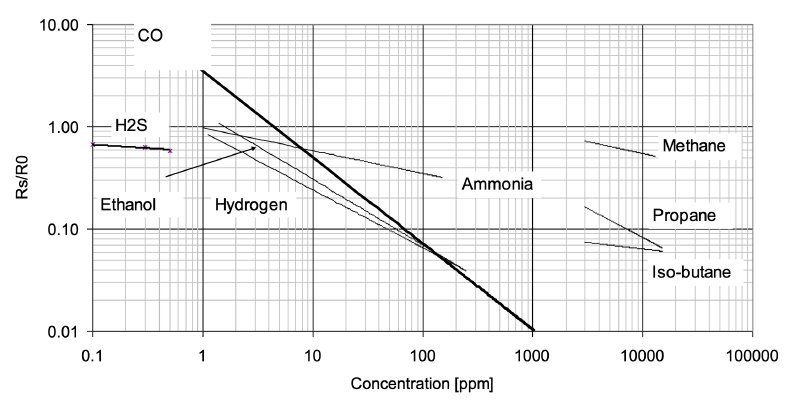
Myth 4: Sensors Only Respond to Their Target Pollutant
Metal‑oxide (MOS) sensors, commonly marketed as VOC detectors, actually measure broad chemical reactivity. Humidity, ethanol from hand sanitizer, perfume, cooking fumes, and even a ripe banana can trigger a spike. Cheap CO₂ monitors often report eCO₂ (equivalent CO₂) derived from VOC reactivity, not true NDIR CO₂ concentrations.
Cross‑sensitivity is pervasive across sensor families: NDIR CO₂ sensors can be affected by temperature, PM sensors by humidity, and MOS sensors by aging of the reactive layer.
Myth 5: Price Equals Accuracy
A $1,000 monitor does not automatically outperform a $200 unit. The base accuracy is dictated by the sensor module; without proper calibration, firmware, and environmental compensation, even premium devices can underperform.
Higher‑priced models may justify their cost through robust firmware, better environmental handling, or industrial enclosures, but these factors rarely translate into a dramatic accuracy leap.
Myth 6: Reference Monitors Are Always Accurate
Regulatory‑grade instruments (FRM, FEM) are the gold standard, yet they too depend on calibration choices and aerosol assumptions. Even two reference monitors can differ by 10–30 % under identical conditions.
Thus, reference instruments provide a reliable baseline, but they are not infallible. Understanding their measurement principles is essential when benchmarking low‑cost sensors.
A Transparent Path Forward
The recurring myths highlight a single truth: transparency is the only way to trust air‑quality data. Companies that openly document sensor calibration, firmware logic, and validation procedures enable users to interpret measurements correctly and to integrate data into larger IoT ecosystems.
For developers and engineers, the takeaway is clear: when selecting or designing a monitoring solution, prioritize open‑hardware designs, documented calibration pipelines, and rigorous testing against reference instruments.
“We design and build our monitors ourselves, test every sensor, document our calibration procedures, and work closely with researchers.” – AirGradient blog, 2025.
By demystifying sensor outputs and exposing the hidden layers of processing, we empower the tech community to build safer, healthier indoor environments.
Source: AirGradient, "The Air Quality Monitoring Myths that Mislead Users," December 2, 2025. https://www.airgradient.com/blog/air-quality-monitoring-myths/
Comments
Please log in or register to join the discussion