Most developers imagine databases as simple file readers that fetch individual rows on demand. The reality is far more interesting: databases almost never touch disk for reads, and when they do, they grab far more data than you asked for. Understanding pages and buffer pools changes how you think about query performance, memory sizing, and system design.

When you run a query like SELECT * FROM orders WHERE user_id = 6, most developers picture the database engine spinning up a disk head, scanning the orders table, finding the matching row, and handing it back. This mental model is wrong in almost every way that matters, and understanding why it is wrong will change how you design systems.
The gap between how developers think database reads work and how they actually work is one of the most persistent sources of performance confusion in backend engineering. You optimize the wrong layer, you size memory incorrectly, you wonder why a "simple" query is slow when your table has 50 million rows. The answer usually lives in the interaction between pages, buffer pools, and disk I/O.
The Naive Model vs. Reality
The intuitive model treats a database like a file with rows. You ask for row 47, it goes and gets row 47. Clean, simple, wrong.
Databases do not read rows from disk. They read pages. A page is a fixed-size block of data, typically 8 kilobytes, that contains multiple rows packed together along with header information, checksums, and row offset arrays. The page is the fundamental unit of storage in virtually every relational database engine.
When PostgreSQL, MySQL InnoDB, or SQL Server needs to retrieve data, it does not pluck a single row from the platter. It loads an entire page into memory. This is not a quirk or an optimization hack. It is a deliberate architectural decision rooted in how physical storage works and how real workloads behave.
Why Pages Exist: The Physics of Disk I/O
To understand why databases use pages, you need to understand what disk reads actually cost.
A mechanical hard drive has seek time (moving the head to the right track), rotational latency (waiting for the right sector to spin under the head), and transfer time (reading the data). The seek and rotation dominate. Once you have positioned the head, reading 8KB versus 4KB costs almost nothing extra. The fixed cost of getting to the data dwarfs the incremental cost of reading more of it.
Even on SSDs, which eliminate seek and rotation, there is still a fixed cost per read operation. The operating system reads in blocks (typically 4KB sectors), and the database engine batches these into its own page structure. The economics still favor reading more data per operation.
This is the classic spatial locality argument, but it applies here with real teeth. If you are going to pay the fixed cost of a disk read anyway, you might as well grab everything nearby. The row you asked for sits on a page alongside dozens of neighboring rows. Those neighbors are statistically likely to be relevant soon.
How the Buffer Pool Changes Everything
The buffer pool is a reserved region of RAM where the database caches pages. When you execute a query, the database does not go to disk. It goes to the buffer pool first.
Here is the actual flow when you run SELECT * FROM orders WHERE user_id = 6 with an index on user_id:
Index lookup in RAM: The database checks the buffer pool for the relevant index pages. If the index is frequently accessed, these pages are almost certainly already cached.
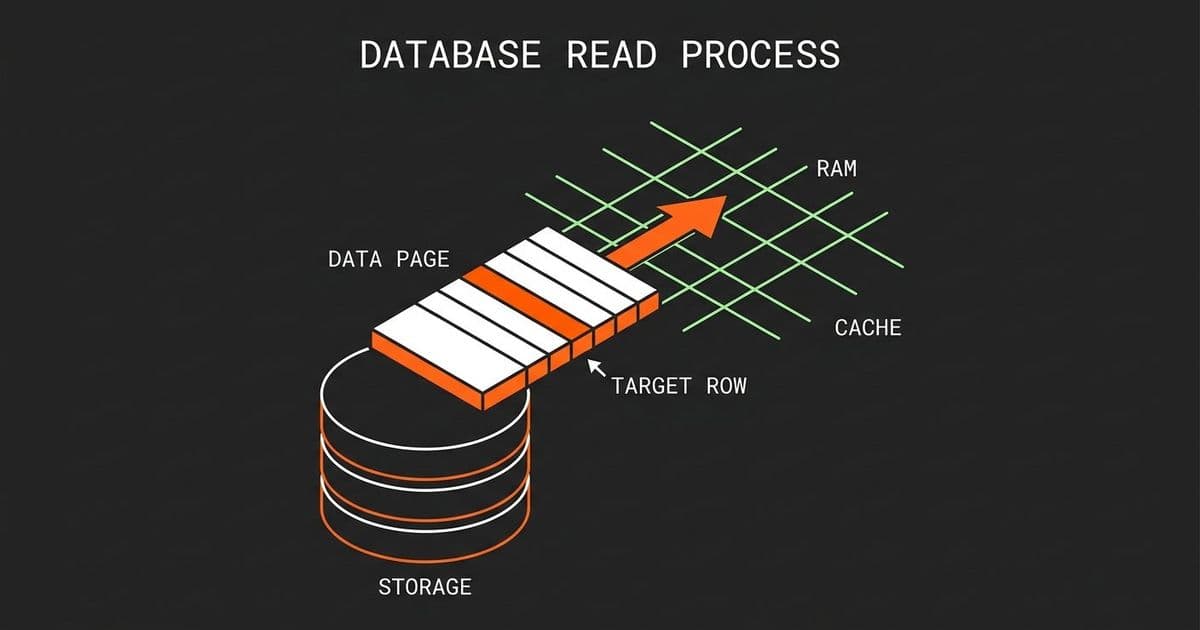
Page resolution: The index entry tells the engine exactly which data page contains the row, and the offset within that page where the row starts.
Data page check: The engine checks the buffer pool for that specific data page. If it is there (and for active data, it usually is), the row is read directly from RAM.
Disk fetch (rare): Only if the page is not in the buffer pool does the engine issue a disk read. It loads the entire 8KB page into the buffer pool, then reads the row from memory.
Return: The specific row is extracted from the page and returned to your application.
The critical insight is that step 4 is the exception, not the rule. For any reasonably sized dataset that fits in memory, the buffer pool absorbs the vast majority of reads. Your queries are running against RAM, not disk.
This is why database servers with sufficient memory are so fast. The buffer pool turns random disk I/O into sequential memory access. It is the same principle that makes CPUs fast: cache the hot data close to the consumer.
Spatial Locality in Practice
The page model creates a powerful side effect: when you load one row, you load its neighbors for free.
Suppose you query for user_id = 6 and that row sits on a page with rows for users 3, 5, 7, 8, and 11. Those rows are now in the buffer pool. The next query for user_id = 7 hits the buffer pool directly. No disk read.
This is not accidental. Database storage engines make deliberate decisions about how to organize pages. In a clustered index (the default in InnoDB and SQL Server), rows are physically stored in index order on pages. Inserting sequential IDs means consecutive rows land on the same or adjacent pages. The storage engine is optimizing for exactly this pattern.
The trade-off is write amplification. When you update a row that is packed tightly with other rows, the entire page must be read, modified, and written back. This is the readoptimized, write-penalized contract of the page model. For read-heavy workloads, it is an excellent trade. For write-heavy workloads, it creates pressure.

When the Buffer Pool Gets Full
You cannot cache everything. The buffer pool has a fixed size, and eventually it fills up. The database must decide which pages to evict to make room for new ones.
Most databases use a variant of LRU (Least Recently Used). Pages that have not been accessed recently are candidates for eviction. PostgreSQL uses a more sophisticated clock-sweep algorithm, and SQL Server uses a modified LRU with hot and cold zones, but the principle is the same: protect the pages that matter most, discard the ones that do not.
This creates an important sizing consideration. If your working set (the pages actively used by your workload) exceeds the buffer pool size, you start thrashing. Pages get loaded, evicted, and reloaded constantly. Performance collapses.
The metric to watch is the buffer pool hit ratio. In PostgreSQL, this is pg_stat_bgwriter and pg_stat_database. In MySQL, it is Innodb_buffer_pool_read_requests versus Innodb_buffer_pool_reads. A hit ratio below 99% for a read-heavy workload is a signal that your buffer pool is undersized or your access patterns are too random.
This is where sizing decisions get interesting. Doubling your buffer pool does not double your hit rate. The relationship is logarithmic. Going from a 95% hit rate to 99% might require doubling memory. Going from 99% to 99.9% might require quadrupling it. The cost of the last few percentage points is enormous.
Failure Modes and Edge Cases
The page model creates failure modes that are invisible in small test datasets but devastating at scale.
Random access patterns: If your queries consistently hit different parts of the table without locality, the buffer pool becomes a revolving door. Every query loads a page that gets evicted before the next one arrives. This is common in analytics queries that scan large ranges, and it is why read replicas with separate buffer pools exist.
Large row updates: Updating a single column in a 4KB row on an 8KB page still requires reading and writing the entire page. If you have wide rows or high update rates, write amplification becomes a real cost. This is one reason why columnar storage (used in OLAP databases) exists: it avoids reading irrelevant columns.
Buffer pool pollution: A single full table scan can evict thousands of hot pages from the buffer pool. PostgreSQL mitigates this with pg_prewarm and buffer pool reservation strategies. SQL Server has "tempdb" and buffer pool partitioning. These are not theoretical concerns. A poorly written reporting query can crater production performance by wiping out the buffer pool.
Dirty page flushes: Modified pages (dirty pages) must eventually be written back to disk. If many pages are dirty simultaneously, the flush can cause I/O spikes. The checkpoint process handles this, but under heavy write load, it can become a bottleneck. This is why write-ahead log (WAL) exists: it provides a sequential write path for durability while dirty pages are flushed asynchronously.
The Broader Pattern: Caching All the Way Down
The buffer pool is a specific instance of a general pattern: push data closer to where it is consumed, accept the cost of invalidation and consistency.
CPU caches work the same way. L1 cache is small and fast, L2 is larger and slower, main memory is larger still. The database buffer pool is main memory acting as a cache for disk. Application-level caches (Redis, Memcached) sit above the database as another layer. Content delivery networks cache at the edge.
Each layer introduces the same trade-off: faster reads in exchange for consistency complexity. The buffer pool must handle pages that are modified while cached. Application caches must handle stale data. CDNs must handle cache invalidation.
The engineering challenge is not making any single cache work. It is sizing and tuning the entire hierarchy so that the hot data lives at the fastest layer. This requires understanding your access patterns, measuring actual hit ratios, and making data-driven decisions about memory allocation.
Practical Implications for System Design
Understanding the page model changes how you approach several common engineering decisions.
Schema design matters more than you think. Narrow rows pack more per page. If you have a table with 10 columns but you always query 3, the other 7 columns are wasting page space and buffer pool capacity. Vertical partitioning or materialized views can help.
Index design is buffer pool design. Every index is a separate set of pages competing for buffer pool space. Too many indexes means index pages compete with data pages, and the working set exceeds memory. Profile your actual query patterns, not your hypothetical ones.
Connection pooling affects memory. Each database connection may use its own memory for sorting, hashing, and temporary results. These do not live in the buffer pool. A connection pool that is too large can cause memory pressure independent of buffer pool sizing.
Monitoring is non-negotiable. You cannot tune what you do not measure. Track buffer pool hit ratio, page reads per second, dirty page counts, and checkpoint frequency. These metrics tell you whether your memory is sufficient or your access patterns need restructuring.
The Takeaway
The database buffer pool is one of the most important performance mechanisms in any data-driven system. It transforms the economics of storage by converting expensive random disk I/O into cheap sequential memory access. But it only works if you understand its constraints.
The page model creates locality that benefits read-heavy workloads but penalizes random access and wide writes. Buffer pool sizing follows diminishing returns. Eviction policies protect hot data but cannot prevent pollution from bad query patterns. Every caching layer you add introduces consistency trade-offs that must be managed.
When a database query is slow, the answer is rarely "add more CPU" or "optimize the SQL syntax." It is almost always about the buffer pool: is the data there, is the hit ratio healthy, and is something evicting your hot pages? Start there, and you will solve most performance problems before they become incidents.
For further reading, check the PostgreSQL documentation on buffer management and the MySQL InnoDB buffer pool documentation. Both go deeper into the specific implementation details of their respective engines.
Comments
Please log in or register to join the discussion