A backend engineer discovers that observability tools can reveal hidden runtime bottlenecks, leading to a hybrid Django-Rust architecture that transforms performance metrics from warning signs into architectural guidance.
I've been running a Django REST Framework stack with Nextcloud integrations, Prometheus metrics, and Grafana dashboards for years. Everything looked stable until my monitoring tools started screaming at me.
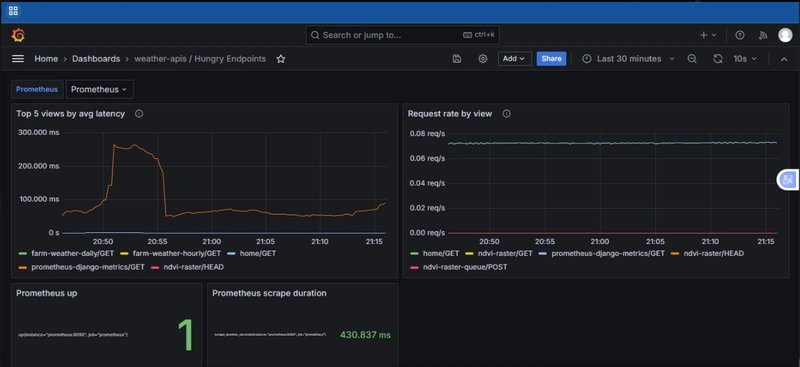
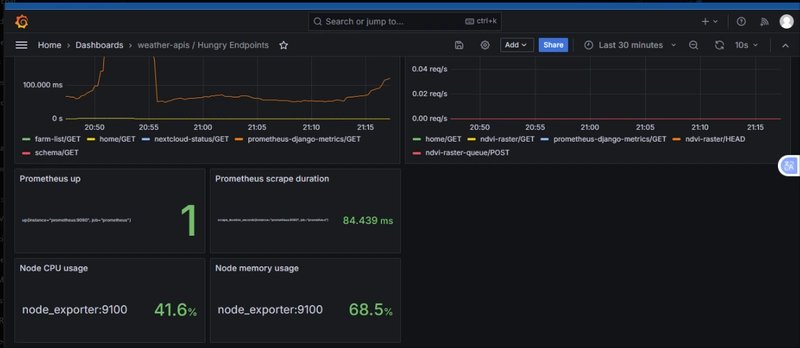
In Grafana, the /prometheus-django-metrics endpoint was showing 250 ms latency spikes while other endpoints like /farm-weather-hourly and /home stayed comfortably under 50 ms. The scrape durations varied wildly between 80 ms and 430 ms, even though request rates remained flat at 0.08 req/s.
That's when I realized the problem wasn't load—it was Python's runtime.
Why Prometheus Exposes Django's Hidden Costs
Each Prometheus scrape forces Django through a performance gauntlet:
- GIL contention: The Global Interpreter Lock serializes metric collection
- Live data gathering: Counters and histograms must be collected in real-time
- Serialization overhead: JSON or text payloads get built from scratch
- Memory churn: Every request triggers new allocations
Even at low volumes, this happens repeatedly at fixed intervals. Observability itself became a performance tax.
The Rust Solution: No More GIL, No More Guesswork
Rust's async ecosystem (Tokio/Actix Web) solves these exact problems:
- True concurrency: No GIL means actual multi-core utilization
- Predictable latency: Consistent performance under heavy I/O
- Memory safety: Compile-time guarantees without garbage collection
- Low-overhead I/O: Async networking with minimal allocations
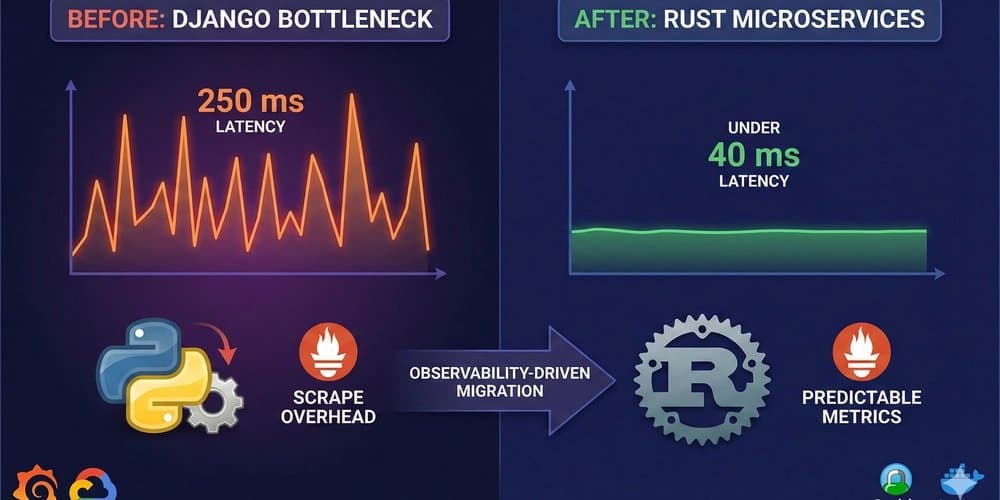
My benchmarks showed Rust microservices consistently staying under 40 ms latency, using 30–40% less CPU, and making Prometheus scrape times nearly constant.
Building a Hybrid Architecture
Rather than abandoning Django entirely, I created a hybrid approach:
Django handles:
- Authentication and authorization
- API orchestration
- Admin interfaces
- Business logic that doesn't need raw speed
Rust handles:
- NDVI raster computation
- Weather data transformation
- Metrics aggregation
- Performance-critical endpoints
They communicate via REST or gRPC, with Prometheus exporting data from both runtimes into unified Grafana dashboards. Caddy provides HTTPS termination and reverse-proxy routing across the entire stack.
What Observability Really Teaches Us
Metrics aren't just health checks—they're architectural signals. Python's runtime trade-offs appear first under introspection, not user load. Rust isn't a replacement for Django; it's a reinforcement for its weak spots.
The key insight: observability drives evolution when used as feedback, not just monitoring.
The Road Ahead
My next experiment measures CPU cycles per request across Django and Rust services under sustained Prometheus scrapes. The goal is proving observability-driven performance scaling in production.
If your /metrics endpoint is your slowest route, don't ignore it. That graph might be pointing directly toward your next architectural upgrade.
For teams running similar stacks, consider:
- Prometheus Documentation for understanding scrape mechanics
- Tokio Runtime for async Rust patterns
- Actix Web Framework for high-performance web services
- Grafana Observability Platform for unified dashboarding
Sometimes the best architectural decisions come not from user complaints, but from the tools we use to watch our systems breathe.
Comments
Please log in or register to join the discussion