Azure Managed Grafana 12 introduces current-user Entra authentication, faster Azure Monitor logs exploration, enhanced Prometheus query capabilities, and updated database monitoring dashboards for Azure-native services.
Azure Managed Grafana 12 is now available, bringing significant enhancements to security, performance, and monitoring capabilities for organizations using Grafana in their Azure environments. This latest release focuses on making authentication more secure, accelerating log analysis workflows, improving Prometheus metrics exploration, and providing better database monitoring experiences.
Enhanced Security with Current-User Entra Authentication
One of the most notable security improvements in Grafana 12 is the introduction of current-user Entra authentication for supported Azure data sources. This feature allows Grafana administrators to configure data sources to reuse the logged-in user's credentials when issuing queries, effectively applying the principle of least privilege at the individual user level.
With current-user Entra authentication, the signed-in user's permissions directly determine what data they can access, eliminating the need for service principals or managed identities in scenarios where individual user permissions are preferred. This approach provides granular access control while maintaining flexibility for other authentication methods where appropriate.
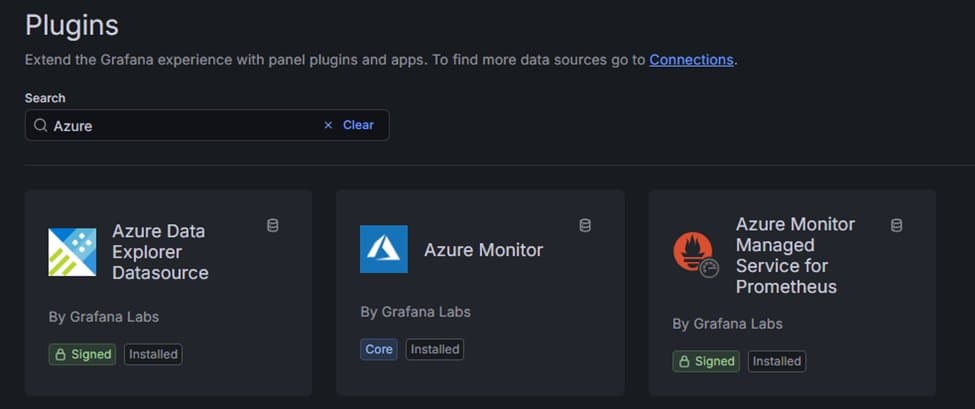
Supported data sources include:
- Azure Monitor
- Azure Data Explorer
- Azure Monitor Managed Service for Prometheus
This enhancement is particularly valuable for organizations with strict compliance requirements or those implementing role-based access control across their observability stack.
Accelerated Log Analysis with Query Builder and Enhanced Explore
For teams working extensively with Azure Monitor logs, Grafana 12 delivers substantial improvements to the log analysis experience. The new Azure Monitor logs query builder enables users to create and refine queries through a visual interface, eliminating the need to write Kusto Query Language (KQL) manually. This feature significantly reduces the learning curve for new users and accelerates the investigation process for experienced analysts.
Beyond the query builder, Grafana Explore now offers enhanced visualization capabilities for log data, making it easier to filter and extract meaningful insights from Azure Monitor logs. The performance improvements are equally impressive - Grafana Explore can now query and render up to 30,000 log records at a time, resulting in faster load times, quicker searches, and more responsive navigation through large log volumes.
These enhancements transform log analysis from a potentially time-consuming task into a more efficient and intuitive process, enabling teams to identify and respond to issues more rapidly.
Enhanced Prometheus Metrics Exploration
Prometheus users will find Grafana 12's metrics exploration capabilities significantly improved. The new drill-down functionality includes sidebar filters for prefix and suffix, allowing users to quickly narrow metrics by naming conventions without writing complex queries. Group-by label support enables the creation of more context-rich groupings, providing better organization and analysis of time series data.
For those new to Prometheus, these enhancements create a smoother path to explore metrics and analyze time series data. The queryless exploration approach is particularly useful when troubleshooting or simply identifying what metrics have been collected.
Grafana 12 also adds OpenTelemetry and native histogram support, including an OTel mode that automates label-join complexities when querying OTLP metrics. This feature simplifies working with OpenTelemetry data and reduces the overhead of managing complex metric queries.
Updated Database Monitoring Dashboards
Azure Managed Grafana now includes new versions of pre-built dashboards for monitoring Azure Database for PostgreSQL and Azure SQL Databases (Preview). These updated dashboards provide teams building on Azure-native databases with a faster path to establishing useful monitoring baselines.
By reducing the time spent wiring panels and configuring visualizations, these pre-built dashboards allow teams to focus on interpreting the data and taking action based on insights rather than spending time on initial setup. The dashboards are designed to work seamlessly with Azure's managed database services, providing relevant metrics and visualizations out of the box.
Getting Started with Grafana 12
Organizations can adopt Grafana 12 by creating a new Azure Managed Grafana instance with Grafana 12 selected, or by upgrading existing Grafana 11 instances through the Azure portal. Once upgraded, teams should consider enabling current-user Entra authentication for supported Azure data sources, testing the new Azure Monitor logs query builder in Explore for day-to-day investigations, and exploring the updated database dashboards if they run Azure PostgreSQL, Azure SQL, or SQL MI.
The release represents a significant step forward in making Grafana more accessible, secure, and performant within the Azure ecosystem. By addressing common pain points in authentication, log analysis, and metrics exploration, Azure Managed Grafana 12 helps organizations build more effective observability practices while reducing the operational overhead of managing their monitoring infrastructure.
For detailed upgrade instructions and technical documentation, visit the Azure Managed Grafana documentation.
Comments
Please log in or register to join the discussion