Microsoft Foundry’s MCP trace evidence shows a practical lesson for enterprise AI teams: agent tool calls must be measured as run-level token behavior, not as isolated span-level billing events.
What Changed
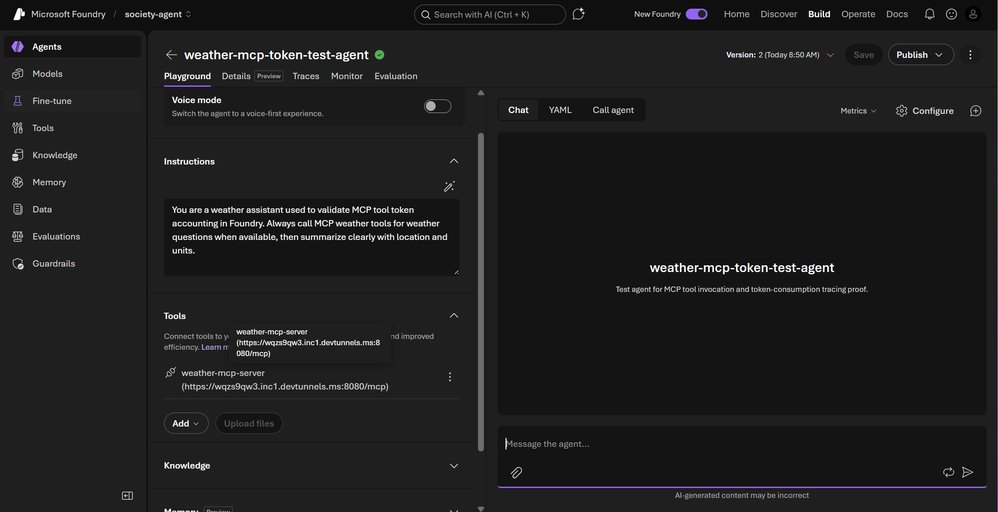
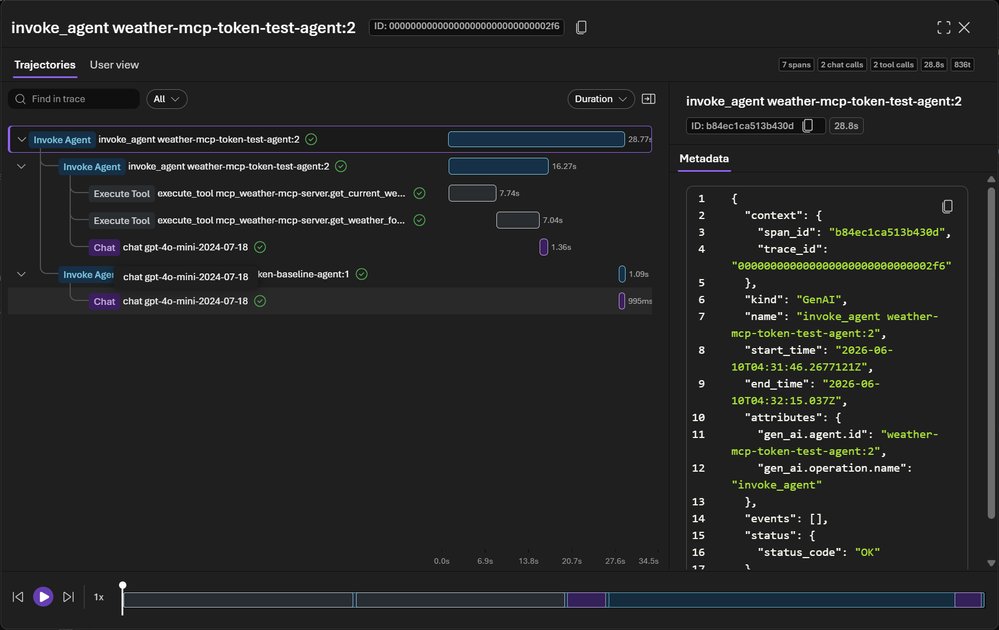
Microsoft Foundry teams working with MCP-enabled agents now have a clearer pattern for explaining why token counts differ across API usage, trace tables, and trajectory views. The reported validation used a prompt agent in Microsoft Foundry with an inline Model Context Protocol tool connected to a weather MCP server over Microsoft dev tunnels. The result was not a new pricing SKU or a billing change. It was a practical operating model for measuring tool-call cost impact in a way that FinOps, platform engineering, and application teams can defend.
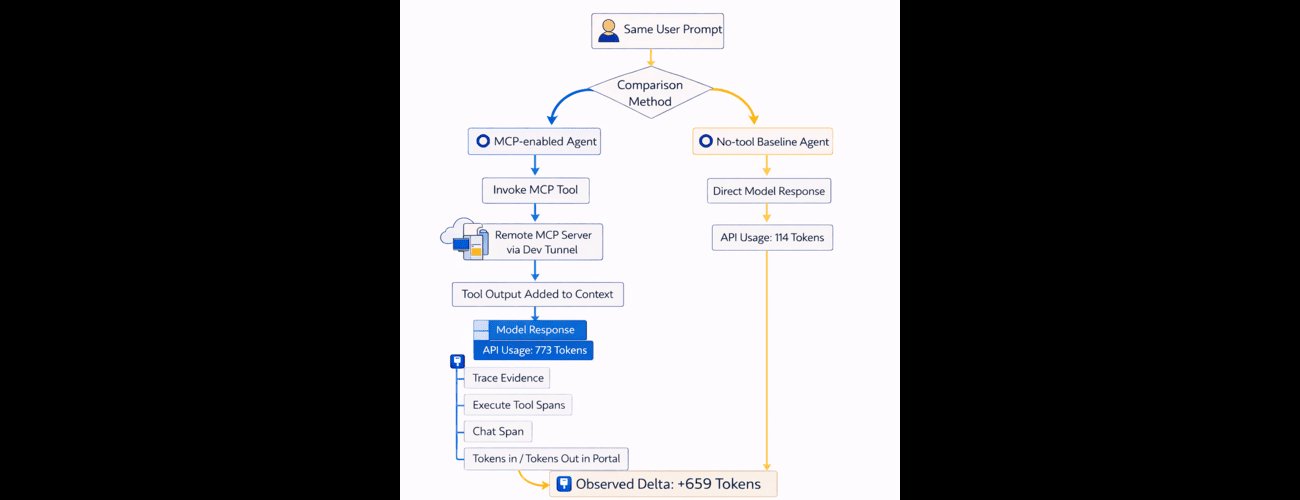
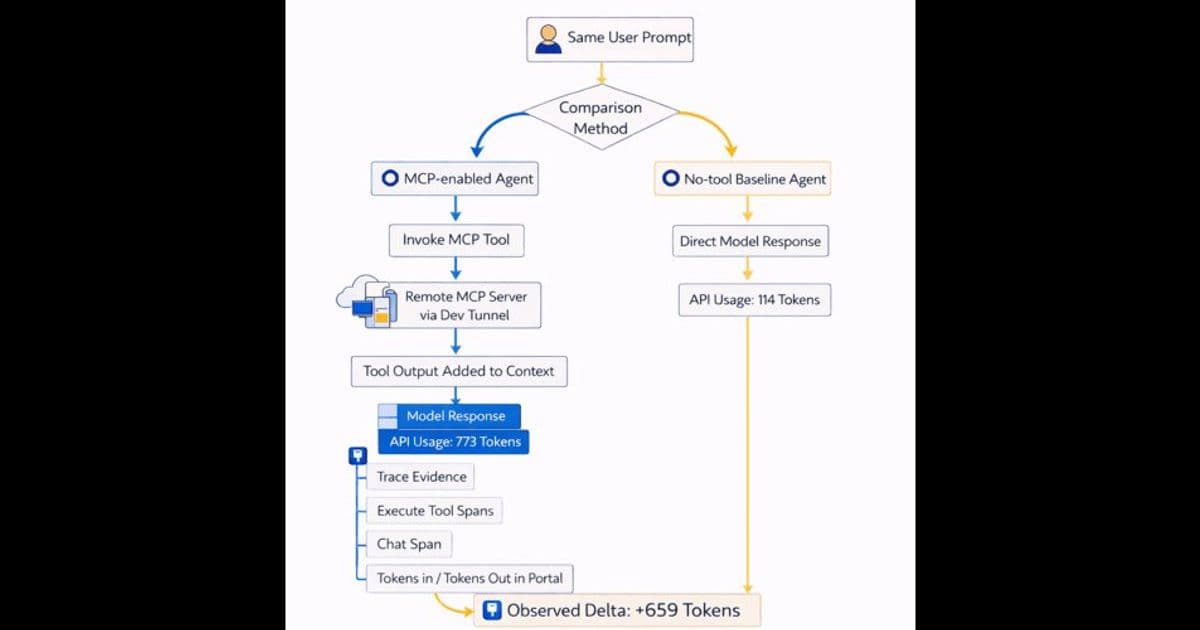
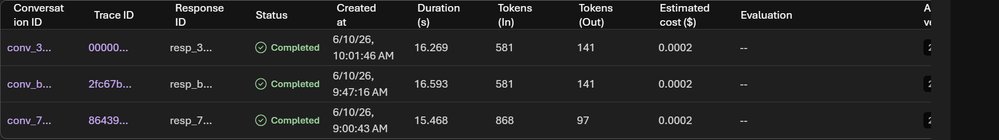
The central finding is simple but operationally significant: MCP tool invocation can materially increase turn-level token usage, but the increase should be measured through controlled API A/B comparison, not by treating every trace span as a billing boundary. In the example run, the MCP-enabled agent reported 581 input tokens, 192 output tokens, and 773 total tokens through the API usage object. A baseline agent using the same prompt but no tool reported 57 input tokens, 57 output tokens, and 114 total tokens. That creates a measured delta of 659 total tokens for the MCP-enabled path.
That delta matters because agentic systems are increasingly priced and governed by aggregate behavior, not only by the visible final answer. A tool call may introduce tool schemas, orchestration instructions, system metadata, intermediate responses, and returned payloads into the model context. Even when the user sees a short response, the model may have processed a much larger context window. For a single weather lookup, the delta may be easy to absorb. For a production service handling thousands or millions of agent turns, the same pattern becomes a budget planning issue.
The article also clarifies a common source of confusion in Microsoft Foundry traces. Portal trace rows, token chips, and trajectory spans may show values such as 581/141, 581/141, or 868/97, while the API usage object for a selected run shows 581/192 and 773 total. Those values are not necessarily contradictory. They may correspond to different response IDs, row scopes, or execution contexts. A trace view is excellent evidence that the tool was listed and executed through spans such as mcp_list_tools and execute_tool. The API usage object is stronger evidence for strict per-response accounting.
For enterprise reporting, that distinction is the difference between a defensible cost model and a meeting full of unresolved screenshots. The right pattern is to separate evidence into two classes. First, API usage fields show the measured token count for a specific response. Second, Foundry trace and trajectory views show operational behavior, including whether the MCP tool was discovered, invoked, and followed by a model response. Both are useful. They should not be forced into a single exact row match unless the response IDs and run IDs prove they are the same transaction.
This is especially relevant because MCP changes the cost profile of agents in a way that is easy to underestimate. Classic chat applications usually have a fairly visible relationship between prompt length, retrieved context, and completion length. MCP-enabled agents add a tool negotiation layer. The model may need tool descriptions, tool input schemas, selection reasoning, tool output handling, and final synthesis. A small user prompt can therefore produce a much larger internal turn. That is not inherently inefficient. It is the cost of giving the agent access to live systems. The business question is whether the resulting accuracy, automation, or workflow completion justifies the additional token spend.
Provider Comparison
Microsoft’s approach in this example is strongest when the buyer already operates inside Azure and needs traceability that maps to existing Azure governance. Foundry sits near Azure AI services, Application Insights OpenTelemetry observability, Azure Monitor, and enterprise identity controls. That makes it a natural fit for organizations that want agent traces, token evidence, and cost review to live near existing Azure operations. The pricing conversation then connects to Azure OpenAI pricing and Azure Monitor pricing, with separate attention to model token charges, provisioned throughput, batch options, monitoring ingestion, and retained logs.
Amazon’s comparable enterprise path is Amazon Bedrock Agents. Bedrock Agents orchestrate foundation models, action groups, APIs, and knowledge bases, and AWS documentation points teams toward trace inspection during testing. For organizations standardized on AWS, Bedrock’s advantage is proximity to IAM, CloudWatch, Lambda, API Gateway, S3, and private application data. The pricing review typically starts with Amazon Bedrock pricing, then expands to model invocation, knowledge base retrieval, vector storage, Lambda execution, logging, and data transfer. In practice, AWS buyers should apply the same A/B principle: run the agent with tool use enabled, run a controlled baseline, preserve request identifiers, and separate model usage from trace and infrastructure telemetry.
Google’s comparable direction is the Gemini Enterprise Agent Platform, including Agent Runtime, tracing, logging, monitoring, retrieval, and framework support. Google’s agent platform is a strong fit when the enterprise data plane already sits in BigQuery, Vertex AI, Google Kubernetes Engine, or Google Cloud observability services. The pricing conversation starts with Google Agent Platform pricing, then branches into Gemini model usage, RAG components, runtime resources, logging, and monitoring. Google also exposes token counting capabilities in its documentation area, which can help teams estimate input size before runtime, but production accounting still needs response-linked evidence.
The strategic comparison is not simply Azure versus AWS versus Google. The real difference is how each provider helps an enterprise answer four questions. Which model call produced this token count? Which tool or retrieval step changed the context size? Which trace proves the agent took the expected path? Which billing meter turns that behavior into cost? Microsoft’s Foundry example is useful because it acknowledges that a portal trace is not always a perfect billing ledger. That honesty helps platform teams design better evidence packages.
From a pricing standpoint, teams should avoid comparing providers only by headline per-token rates. Agent workloads include hidden multipliers. Tool schemas may be injected repeatedly. Retrieval results may be longer than expected. Guardrails, system instructions, and policy text can add fixed overhead to every run. Observability can create separate ingestion and retention costs. Provisioned capacity can reduce unit variability but introduce commitment risk. Batch APIs can reduce price for noninteractive work but may be irrelevant to real-time agents. Regional and data-zone deployment choices can affect availability, latency, residency, and price at the same time.
A practical provider scorecard should include at least six columns: model token price, tool and agent orchestration transparency, trace export support, observability cost, identity and network integration, and migration portability. Microsoft will often score well for Azure-native governance and enterprise control plane alignment. AWS will often score well for teams with mature IAM, event-driven architecture, and service integration depth. Google will often score well for data-heavy AI systems tied to BigQuery, Vertex AI, Gemini tooling, and managed retrieval. None of those strengths removes the need for controlled token measurement. They only change where the evidence is captured and how it flows into cost reporting.
MCP adds another layer to the provider decision. Because MCP is an open protocol for connecting AI applications to external systems, it can reduce custom integration work across clients and tools. It can also make migration planning more realistic because a well-designed MCP server can sit outside a single provider’s agent framework. That said, portability is not automatic. Tool authentication, network exposure, trace schemas, model behavior, and prompt formatting differ by platform. A Microsoft Foundry MCP tool connected through a dev tunnel for testing will not be production-equivalent to a private AWS VPC integration or a Google Agent Runtime deployment. The protocol helps with interface consistency, while the cloud platform still defines operations, identity, monitoring, and cost control.
Business Impact
The immediate business impact is better FinOps discipline for agentic AI. Many teams can already report total model spend after the invoice arrives. Fewer can explain why a specific agent workflow became more expensive after a tool was added. The Foundry validation gives those teams a repeatable method: use the same prompt, compare a baseline agent to an MCP-enabled agent, capture API usage for both runs, preserve response IDs, and attach trace screenshots only as operational evidence. That pattern turns an ambiguous token discussion into a reviewable cost delta.
For executives and platform owners, the key number in the example is not 773 total tokens. It is the increase from 114 to 773 total tokens under controlled conditions. That is a roughly 6.8x turn-level increase for the specific test. The number should not be generalized to every MCP tool, every model, or every prompt, but it proves the class of impact. A tool-enabled agent can consume materially more tokens than a simple baseline even when the user task appears small. Budget models should therefore treat tool enablement as a cost variable, not a minor implementation detail.
For engineers, the implementation lesson is to instrument the agent workflow before arguing about optimization. Start by capturing input_tokens, output_tokens, total_tokens, model name, prompt version, tool version, response ID, trace ID, and environment. Then record the tool payload size and whether the tool response is passed back into the model verbatim, summarized, filtered, or structured. The cheapest optimization may not be changing models. It may be shrinking tool schemas, reducing verbose tool responses, caching stable tool metadata, limiting retrieval result size, or routing simple questions away from tool-enabled agents.
For FinOps teams, the reporting template should separate four cost layers. Model usage covers input and output tokens. Agent orchestration covers additional model turns and tool-selection context. Tool execution covers the infrastructure behind the tool, such as functions, APIs, databases, or network calls. Observability covers trace, log, metric, and retention costs. Azure customers should connect this pattern to Azure cost analysis, Azure Monitor, and Foundry traces. AWS customers should connect it to Bedrock usage, CloudWatch, Lambda, and data services. Google customers should connect it to Gemini usage, Agent Platform telemetry, Cloud Logging, and retrieval components.
Migration planning also changes. A team moving from a custom Azure OpenAI chat app to Microsoft Foundry with MCP tools should not assume the old token profile will carry over. A team moving from Bedrock Agents to Foundry, or from Foundry to Google’s agent runtime, should preserve a benchmark suite of prompts and tool scenarios. The suite should include simple direct-answer prompts, tool-required prompts, retrieval-heavy prompts, failed tool calls, permission-denied paths, and long tool responses. Each provider should be tested with the same business task, not merely the same text prompt, because the orchestration layer may transform the prompt before the model sees it.
There is also a governance benefit. When trace evidence and billing evidence are mixed casually, every variance looks suspicious. When evidence is labeled by source and response ID, reviewers can see what each artifact proves. API usage proves the measured token count for a response. Trace tables prove run observability at their displayed scope. Trajectory views prove execution sequence and tool invocation semantics. Screenshots prove what the portal showed at review time, but they should be paired with IDs and exported data where possible. This level of discipline shortens reviews because the team no longer has to reconcile unrelated rows by hand.
The recommended operating model is straightforward. For every production candidate agent, create a baseline run with tools disabled or removed. Create a tool-enabled run with the same user prompt and comparable system instructions. Capture API token usage for both. Attach trace and trajectory evidence for the tool-enabled run. Write one reconciliation paragraph that states which evidence source is authoritative for token delta and which evidence source is used for execution behavior. Repeat the test when the prompt template, model, tool schema, retrieval configuration, or provider runtime changes.
The broader lesson is that agent cost management is becoming an architecture practice. MCP makes agents more useful by connecting them to systems of record and operational tools. That same connection expands the amount of context the model may process. Cloud providers can expose better traces, pricing pages, and observability integrations, but enterprises still need measurement discipline. The winning teams will not be the ones that ban tool calls to control cost. They will be the ones that know which tool calls create business value, which ones create avoidable context overhead, and which evidence proves the difference.
Microsoft Foundry’s example gives Azure teams a practical starting point, and it gives multi-cloud teams a reusable comparison pattern. Measure with API A/B runs. Use traces for execution proof. Keep IDs attached. Compare providers by total workload economics, not only model rate cards. That is the level of accounting agentic AI now requires.
Comments
Please log in or register to join the discussion