
A comprehensive performance comparison between SPA and hypermedia architectures for an AI chat application, revealing 7.5× faster mobile load times and 26× smaller bundle sizes under real-world network constraints.
CASE STUDY Michael Bolli · 25.02.2026 Measured February 2026 · Lighthouse + Chrome DevTools Performance Profiling · View source & raw data →
TL;DR We built an AI chat application using hypermedia architecture (sending HTML from the server) and compared it against a production SPA implementation (running a complex JavaScript app in the browser) under poor mobile network conditions. The simpler approach eliminates main-thread blocking entirely, is 26× smaller, and 7.5× faster to become interactive than the popular approach. The difference matters most where it counts: on phones with slow connections and limited battery.
But low complexity also brings other advantages: fewer dependencies to maintain, simpler deployment, and a dramatically smaller security surface to monitor.
Methodology: Apples to Apples
A fair comparison requires context. We compared our custom PHP/Swoole/Datastar hypermedia implementation against the Vercel AI SDK Chatbot—a production-grade reference implementation with 86 contributors and 600+ commits of optimization.
Why this comparison is valid
We chose the Vercel AI SDK because it represents the standard approach most teams would use when building an AI chat with Next.js. Our goal wasn't to benchmark the fastest possible SPA against the fastest possible hypermedia app, but to show what typical implementation choices produce. The Vercel SDK is well-maintained, widely used, and follows React/Next.js best practices—making it a representative baseline for real-world SPA development.
Both applications implement the same core features: real-time AI streaming, chat history, document artifacts, and authentication. Test conditions were identical: Chrome 144, Slow 4G network simulation (1.6 Mbps, 150ms RTT), and 4× CPU throttling to simulate mid-range mobile devices.
Lighthouse Scores: The Mobile Gap
On desktop with fast connections, both architectures perform reasonably well. The real differences emerge under constrained conditions—precisely the environment where most of the world's users operate.
Desktop (Unthrottled)
| Metric | SPA | Hypermedia | Difference |
|---|---|---|---|
| Performance Score | 93 | 100 | similar |
| First Contentful Paint | 0.5s | 0.3s | 1.7× faster |
| Largest Contentful Paint | 1.6s | 0.3s | 5.3× faster |
| Total Blocking Time | 110ms | 0ms | much better |
| Time to Interactive | 1.6s | 0.3s | 5.3× faster |
| Cumulative Layout Shift | 0 | 0.001 | ~tie |
Mobile (Slow 4G + 4× CPU Throttling)
This is where architectural choices become visible. The JavaScript bundle that's barely noticeable on a fast desktop connection becomes a critical bottleneck when the network is slow and the CPU is constrained.
| Metric | SPA | Hypermedia | Difference |
|---|---|---|---|
| Performance Score | 54 | 100 | 1.9× more |
| First Contentful Paint | 1.6s | 1.1s | 1.5× faster |
| Largest Contentful Paint | 8.1s | 1.1s | 7.4× faster |
| Total Blocking Time | 780ms | 0ms | eliminated |
| Time to Interactive | 8.2s | 1.1s | 7.5× faster |
| Speed Index | 3.9s | 1.1s | 3.5× faster |
The SPA's Total Blocking Time of 780ms vs 0ms means the main thread is blocked for nearly a full second just parsing and executing JavaScript—time during which the page is visually present but completely unresponsive to input. The hypermedia version eliminates blocking entirely: its server-rendered HTML is immediately usable the moment it arrives.
What Gets Sent Over the Wire
| Metric | SPA | Hypermedia | Ratio |
|---|---|---|---|
| HTTP Requests | 36+ | 8 | 4.5× fewer |
| Transferred (compressed) | ~1.1 MB | 41.9 KB | 26× smaller |
| Resources (uncompressed) | ~4.5 MB | 173 KB | 26× smaller |
| JavaScript (transferred) | ~1.1 MB | 13.5 KB | 80× smaller |
The 26× reduction in transferred bytes directly translates to faster loads on slow networks. On a 1.6 Mbps connection, downloading 1.1 MB takes approximately 5.5 seconds before the browser can even begin parsing. 41.9 KB takes about 0.2 seconds.
Visual Proof: Where the CPU Time Goes
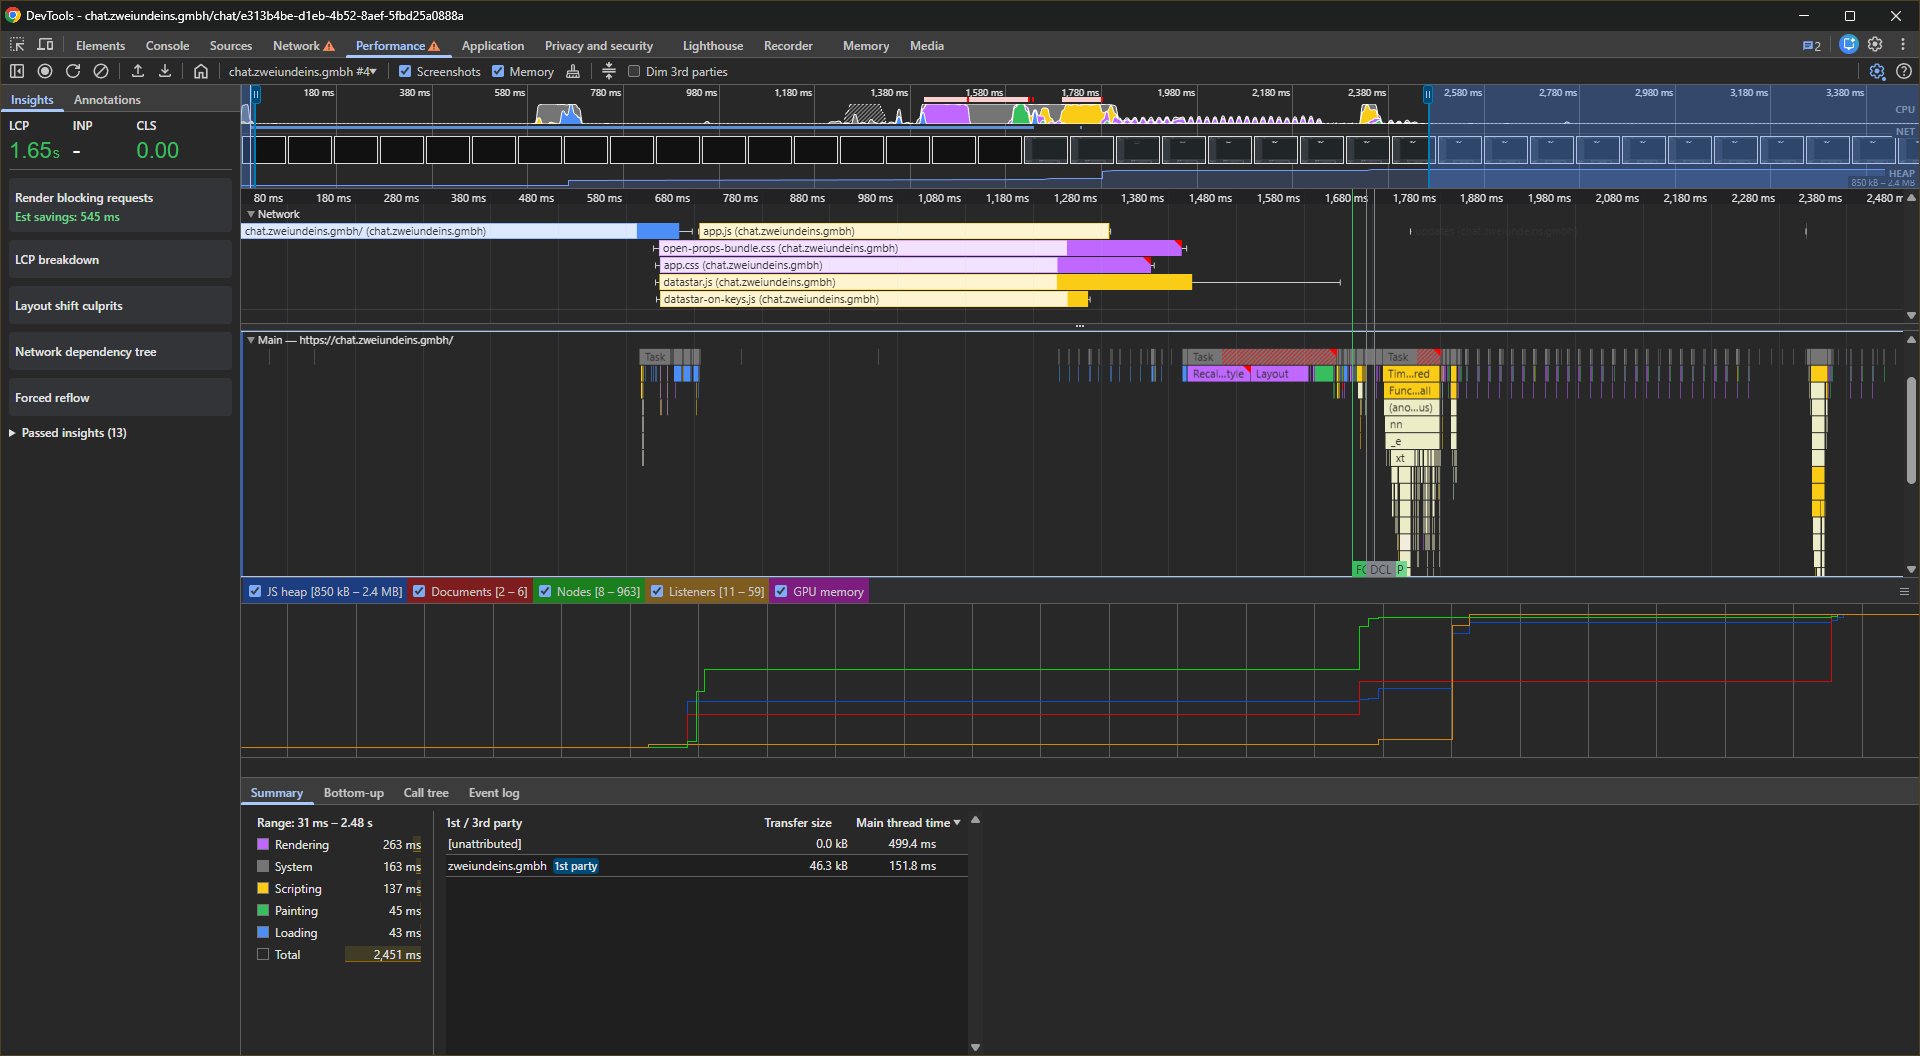
Performance profiling during actual page loads and chat interactions reveals how each architecture uses CPU resources. The flamegraphs below show Chrome DevTools Performance traces under identical conditions: Slow 4G network throttling and 4× CPU slowdown.
- Scripting — JavaScript execution
- Rendering — Style/layout calculation
- Painting — Pixels to screen
- System — Browser internals
- Loading — Network activity
- Idle — Available for user input
- Memory — JS heap (bottom graph)
Page Load Comparison
Drag the slider to compare SPA (left) vs Hypermedia (right)

Page load flamegraphs under Slow 4G + 4× CPU throttling. Notice the dense, tall scripting blocks (yellow) in the SPA vs. the shallow, sparse execution in Hypermedia. The SPA's memory graph (bottom) shows JS heap growing +13.5 MB during initial load—Hypermedia grows only +1.5 MB (9× less).
| Metric | SPA | Hypermedia | Ratio |
|---|---|---|---|
| Largest Contentful Paint | 8.1s | 1.1s | 7.4× faster |
| Total Time | 11.56s | 2.45s | 4.7× faster |
| Scripting Time | 5,613ms | 257ms | 21.8× less |
| Main Thread Time | 4,145ms | 651ms | 6.4× less |
| JS Heap Growth | +13.5 MB | +1.5 MB | 9× smaller |
| Transfer Size | ~1,107 KB | 41.9 KB | 26× smaller |
| DOM Nodes, final | 326 | 963 | 3× more |
| Event Listeners | 349 | 59 | 5.9× fewer |
The key visual difference in the flamegraphs: the SPA shows tall, dense stacks of JavaScript execution (yellow blocks) that dominate the trace. Hypermedia's flamegraph is shallow and sparse—most of the time is spent idle or in native browser rendering, not executing JavaScript.
Note: Scripting Time and Main Thread Time are from different DevTools views—the Summary panel tallies all scripting across threads (including workers), while Main Thread Time is the aggregate task duration from the Activity tab. The two overlap but don't cover identical scope, which is why Scripting can appear higher than Main Thread Time.
The higher DOM node count in Hypermedia (963 vs 326) reflects server-rendered content that's immediately visible. The SPA starts with a minimal DOM and builds it client-side through hydration—which explains why it has 5.9× more event listeners attached despite fewer nodes.
Chat Response Comparison (Streaming)
Drag the slider to compare SPA (left) vs Hypermedia (right)
Chat response flamegraphs. The SPA spends over 4× more time in JavaScript execution (10,500ms vs 2,485ms). Hypermedia distributes work more evenly—spending proportionally more time in rendering and painting as HTML patches hit the real DOM on every SSE chunk.
| Metric | SPA | Hypermedia | Notes |
|---|---|---|---|
| LCP | 206ms | 35ms | 6× faster |
| Scripting | 10,500ms | 2,485ms | 4.2× less JS work |
| Rendering | 1,274ms | 2,225ms | Hypermedia patches real DOM on every chunk |
| Painting | 538ms | 1,240ms | More paint = more DOM content |
| Total | 19,686ms | 12,500ms | 37% faster overall |
| JS Heap Growth | +10.4 MB | +1.9 MB | 5.5× less memory |
| V8 Node Allocs ¹ | 394 → 822 | 3,164 → 34,559 | Hypermedia high GC churn; SPA modest growth |
During streaming, the SPA spends over 4× more time executing JavaScript than the hypermedia version (10,500ms vs 2,485ms). Hypermedia compensates with more rendering and painting time—because Datastar patches the real DOM on every incoming SSE chunk rather than buffering updates in a virtual DOM. The browser's native HTML parser does the heavy lifting, which shows up as rendering cost rather than scripting cost.
Overall Hypermedia completes the full chat response cycle 37% faster (12,500ms vs 19,686ms).
¹ V8 Node Allocs counts all nodes in the V8 heap—attached and detached (pending GC). Datastar replaces DOM patches on each SSE event, creating orphaned nodes that accumulate until garbage-collected; the live DOM after streaming completes is ~400–600 nodes. React reconciles mostly in-place, so far fewer detached nodes accumulate (+428 vs +31,395). This metric reflects GC pressure, not live DOM size.
Why Memory Matters
The 5.5× difference in memory growth (10.4 MB vs 1.9 MB per chat interaction) compounds over time. On mobile devices, high memory pressure triggers garbage collection pauses—visible as UI jank that users perceive as poor performance. Each spike in the memory graph represents potential frame drops.
React's reconciliation overhead is the primary driver: it maintains a virtual DOM tree in memory on top of the real DOM, and that overhead grows with each streamed token.
Streaming Efficiency: SSE Compression
Real-time AI chat relies on Server-Sent Events (SSE) for token-by-token streaming. The two architectures differ not just in compression, but in the fundamental connection model: Hypermedia keeps a single persistent SSE stream open for the whole session, while the SPA opens a new streaming POST for every message turn. That difference compounds dramatically over a conversation: after 10 turns, Brotli on a persistent stream achieves a 58.5× compression ratio—turning a 29× raw-data disadvantage into a 2× transferred-data advantage.
Single Turn (Claude 4.5 Haiku, same prompt)
| Metric | SPA | Hypermedia | Notes |
|---|---|---|---|
| Endpoint | /chat (per-request) | /updates (persistent) | |
| Compression | None ² | Brotli | |
| Transferred | 14.4 KB | 6.0 KB | 2.4× smaller |
| Uncompressed | 14.4 KB | 112 KB | Hypermedia re-streams full fragment per token (naïve impl) |
| Compression Ratio | 1× | 18.7× |
Multi-Turn Conversation (10 turns, identical prompts)
| Metric | SPA | Hypermedia | Notes |
|---|---|---|---|
| SSE connections | 10 (one per turn) | 1 (persistent) | Hypermedia reuses one open stream |
| Compression | None ² | Brotli | 58.5× |
| Cross-turn repetition inflates ratio | Transferred (streaming) | ~114 KB | 55.8 KB |
| Uncompressed (streaming) | ~114 KB | 3,265 KB | Naïve impl re-streams full fragment per token |
| 58.5× Brotli compression ratio after 10 turns on a persistent SSE stream |
Worth being honest about what our PHP implementation actually does: every time the AI outputs a new word, it re-streams the entire message HTML fragment from scratch—not just the new token. Each chunk replaces the previous one in full. This is a deliberate simplicity choice, not a Datastar requirement: write the naive thing until you have a reason not to. It explains the 29× raw data gap.
Despite that self-imposed inefficiency, the combination of Brotli on a persistent connection beats the SPA over 10 turns. The compression more than compensates for the naïve implementation. The single-turn advantage (2.4×) already holds: Brotli's 18.7× compression ratio turns a 7.8× raw-size disadvantage into a net win. The multi-turn advantage grows further: a persistent stream lets Brotli compress all turns together, exploiting the cross-turn repetition in the chat HTML that builds up as the conversation grows. After 10 turns Hypermedia transfers half the data of the SPA—even starting from an implementation that wastes 29× more bandwidth before compression.
² Next.js streaming POST responses (/chat) have no Content-Encoding header. Enabling compression middleware on the streaming route would partially close this gap, but the per-connection overhead and inability to share a Brotli dictionary across turns would remain.
Codebase & Operational Complexity
| Metric | SPA | Hypermedia | Notes |
|---|---|---|---|
| Dependencies (production) | 799 | 69 | 11.6× fewer |
| Disk (node_modules/vendor) | 793 MB | 25 MB | 31.7× smaller |
| Build Step | Required | No | — |
| Cold Start | 1.85s | 0ms | No serverless penalty |
| Hosting | Vercel (usage-based) | $20/year VPS | Predictable cost |
Fewer dependencies mean a smaller attack surface, simpler security audits, and fewer breaking changes to manage during upgrades. The 31.7× reduction in production disk usage also translates to faster CI/CD pipelines and simpler container images.
The Economics of Simplicity
Technical metrics are interesting, but what do they mean for the business? Architecture decisions compound over time, affecting not just performance but development velocity, operational costs, and team productivity.
Features vs. Maintenance: Where Does Time Go?
Consider what 799 production dependencies mean in practice. Each dependency is a potential source of security vulnerabilities that need patching, breaking changes that need addressing, and compatibility issues that need debugging. With the JavaScript ecosystem's rapid release cycles, a significant portion of development time goes to keeping the dependency tree healthy rather than building features.
- 11.6× fewer dependencies to audit, update, and secure
- 0 build step means faster iteration and simpler deploys
- $20/yr predictable hosting vs. usage-based pricing surprises
The Hidden Cost of Complexity
Complex architectures don't just slow down the application—they slow down the team. Every architectural layer adds cognitive load: developers must understand React's reconciliation, Next.js's rendering modes, the Vercel deployment model, and the interaction between client and server state. This knowledge takes time to acquire and maintain.
In contrast, a server-authoritative hypermedia architecture has one source of truth (the server), one rendering location (the server), and one deployment target (a simple process). New team members can become productive faster, and debugging follows a straightforward request-response model rather than tracing state through multiple layers.
Total Cost of Ownership
When evaluating architecture, consider the full picture:
- Development costs: How much time is spent on framework-specific problems vs. business logic? How long does onboarding take?
- Infrastructure costs: What's the monthly bill? How predictable is it? What happens during traffic spikes?
- Opportunity costs: What features could have been built with the time spent on dependency upgrades and build pipeline maintenance?
- Risk costs: How large is the attack surface? How quickly can security patches be deployed?
When Simplicity Pays Off
The economic case for reduced complexity is strongest wherever time and money are finite—which is most projects. A small team without a dedicated DevOps engineer or front-end specialist simply cannot afford to babysit a 799-dependency graph. When a transitive package ships a breaking change, it isn't an abstract inconvenience; it's a half-day of unplanned work that displaces a feature. The leaner the dependency tree, the fewer of those interruptions accumulate.
For applications expected to live years rather than months, this dynamic becomes even more pronounced. Initial development costs are a one-time investment, but maintenance compounds indefinitely. Every major framework upgrade, every deprecated API, every shift in the JavaScript ecosystem adds to the running total. Fewer dependencies and a simpler mental model keep that cost manageable—and institutional knowledge stays relevant longer.
Hosting economics follow the same logic. Usage-based pricing can absorb a modest traffic spike and return a billing surprise that forces an architecture review you didn't plan for. A predictable $20/year VPS doesn't do that. The cost is known in advance, scales to the team's budget, and keeps the focus on the product rather than on cloud spending dashboards.
Finally, there's the audience itself. The total elimination of blocking time (0ms vs 780ms) and the 7.5× improvement in Time to Interactive aren't benchmark curiosities—they determine whether a user on a mid-range phone with a patchy connection actually gets to use the product, or abandons it in the first ten seconds.
Limitations & Caveats
What This Article Doesn't Cover
- Hardware specificity: Tests were conducted on specific hardware (AMD Ryzen 7 Pro 7840U desktop, emulated mobile). Results may vary on different devices.
- Network emulation: Chrome's Slow 4G throttling simulates but doesn't perfectly replicate real mobile network conditions with packet loss and jitter.
- Content types: This comparison focuses on an AI chat application. Performance characteristics may differ for other content types (e-commerce, dashboards, etc.).
- Team expertise: Developers coming from SPA backgrounds must unlearn client-side state management patterns and embrace server-authoritative thinking—a mental shift that takes time.
- Ecosystem maturity: The React/Next.js ecosystem has more tutorials, Stack Overflow answers, and hiring availability than hypermedia approaches.
- Benchmarking is hard: Meaningful performance measurement is inherently difficult. Results vary across runs, throttling profiles approximate but don't replicate real-world conditions, and small methodology choices (cache state, viewport size, network profile) can shift numbers significantly. AI applications add another layer of variability: no two LLM responses are identical in length or timing, making streaming benchmarks particularly hard to reproduce exactly. Treat the ratios as directional, not absolute.
- Feature completeness: The PHP port is a working proof-of-concept. Some features (file attachments, edit/regenerate) aren't implemented.
When to Choose What
Architecture decisions should be driven by requirements, not trends. Here's a framework for thinking about the tradeoffs:
CONSIDER HYPERMEDIA IF:
- Content-heavy applications (documents, articles, dashboards)
- SEO is important for your business
- Global audience with varied network conditions
- Real-time streaming is a core feature
- You want predictable hosting costs
- Team has backend expertise
- Long-term maintainability is prioritized
- You want to minimize security attack surface
CONSIDER SPA IF:
- Offline-first is a hard requirement
- Heavy client-side computation (image/video editing, CAD)
- Complex drag-and-drop or canvas interactions
- Existing React team with established patterns
- Integration with React Native for mobile apps
- Third-party component ecosystem is critical
- Users have consistently fast connections
Many applications don't need the complexity of a full SPA. The question isn't "which is better" but "which tradeoffs match your constraints."
Summary
| Category | Winner | Key Metric |
|---|---|---|
| Mobile Performance Score | Hypermedia | 100 vs 54 |
| Time to Interactive (mobile) | Hypermedia | 1.1s vs 8.2s (7.5×) |
| Total Blocking Time (mobile) | Hypermedia | 0ms vs 780ms (eliminated) |
| Page Weight | Hypermedia | 42 KB vs 1.1 MB (26×) |
| JavaScript Bundle | Hypermedia | 13.5 KB vs 1.1 MB (80×) |
| JS Execution Time (load) | Hypermedia | 257ms vs 5,613ms (21.8×) |
| Memory per Interaction | Hypermedia | +1.9 MB vs +10.4 MB (5.5×) |
| SSE Compression | Hypermedia | Brotli 58.5× vs none; 2× less transferred over 10 turns |
| Dependencies (prod) | Hypermedia | 69 vs 799 (11.6×) |
Hypermedia wins all 9 measured categories outright.
These results don't mean SPAs are "bad" or that every application should use hypermedia. They demonstrate that the default choice of SPA architecture carries real costs that become significant under constrained conditions—and that alternatives exist.
Reconsidering your web architecture? At zwei und eins gmbh, we specialize in reducing complexity while improving real-world performance. These architectural tradeoffs are exactly what we optimize in production systems. Get in touch →
Comments
Please log in or register to join the discussion