Lilaq emerges as a powerful plotting library designed specifically for Typst, bringing publication-ready graphics with real-time preview capabilities to this modern typesetting system.
In the evolving landscape of document preparation and scientific publishing, Typst has established itself as a compelling alternative to traditional systems like LaTeX. With its modern approach and intuitive design, Typst addresses many of the pain points associated with legacy typesetting tools. However, one critical component has been notably absent: robust, native data visualization capabilities. This gap is now being filled by Lilaq, a sophisticated plotting library that seamlessly integrates with Typst to create publication-quality graphics.
Understanding the Typst Ecosystem
Typst represents a paradigm shift in document preparation, offering a markup-based approach that combines simplicity with powerful features. Unlike LaTeX's complex syntax and compilation model, Typst provides instant preview and a more intuitive way to structure documents. As Typst continues to mature, the need for specialized tools that extend its functionality becomes increasingly apparent.
Data visualization stands as one of the most critical aspects of scientific and technical documentation. From research papers to technical reports, the ability to effectively communicate complex information through visual representations is indispensable. This is where Lilaq enters the picture, providing Typst users with native plotting capabilities that were previously unavailable.
Introducing Lilaq
Lilaq (pronounced /ˈlaɪlək/) emerges as a comprehensive plotting library specifically designed for Typst. Its development represents a significant step forward in the Typst ecosystem, addressing a crucial need for integrated data visualization. The library aims to provide publication-ready graphics with real-time preview capabilities, making it an ideal tool for researchers, scientists, and technical writers who work with Typst.
At its core, Lilaq is designed with several key principles:
- Seamless Integration: The library operates within Typst's document structure, allowing plots to be embedded naturally alongside text.
- Publication Quality: Output is optimized for academic and professional publications.
- Real-time Preview: Changes to data or styling are immediately visible in Typst's preview.
- Consistent Styling: Visual elements align with Typst's design philosophy.
- Interoperability: Works alongside other Typst libraries, particularly Zero, for enhanced functionality.
- Powerful Configuration: Offers extensive customization options while maintaining simplicity.
Plotting Capabilities and Types
Lilaq supports an impressive array of plot types, catering to diverse visualization needs:
- Scatter plots: Ideal for displaying relationships between two variables.
- Fill-between: Useful for highlighting areas between curves or data series.
- Bar and horizontal bar charts: Effective for categorical data comparison.
- Stem and horizontal stem plots: Suitable for discrete data representation.
- Box plots and horizontal box plots: Excellent for statistical distribution visualization.
- Color mesh: For representing three-dimensional data as a color map.
- Contour plots: Used to visualize three-dimensional data in two dimensions.
- Quiver plots: Displaying vector fields.
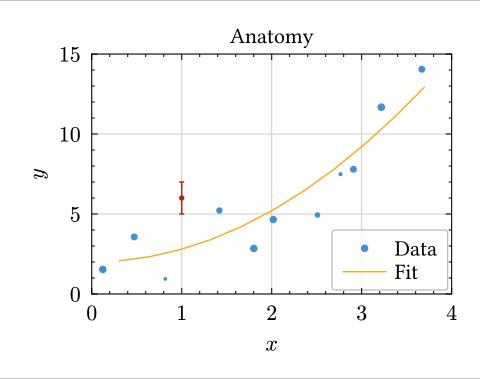
Anatomy of a Lilaq plot, showing the various components that can be customized
Configuration and Customization
Lilaq's power lies in its extensive configuration options while remaining accessible to users. The library employs a modular approach, allowing users to customize virtually every aspect of their plots:
- Title and labels: Customizable titles, x-axis labels, and y-axis labels.
- Axis configuration: Complete control over axis appearance, including positioning, scaling, and formatting.
- Ticks and tick labels: Precise control over tick marks and their labels.
- Legend: Flexible legend positioning and styling.
- Grid lines: Optional grid lines for improved readability.
- Spines: Customizable axis lines (spines).
The library also supports plot cycles, enabling consistent styling across multiple plots with minimal code. This feature is particularly valuable for creating cohesive document-wide visual styles.
Integration with Typst Documents
One of Lilaq's most significant advantages is its deep integration with Typst. Unlike traditional approaches where plots are generated in separate applications and imported as images, Lilaq operates natively within Typst's document structure.
This integration offers several benefits:
- Consistent styling: Plots automatically adopt the document's fonts and color schemes.
- Responsive sizing: Plots adjust to document layout changes.
- Accessibility: Text within plots is selectable and searchable.
- Version control: Plot code can be tracked alongside document text.
- Reproducibility: Complete visualization workflow contained in a single document.
Learning Resources and Community Support
Lilaq's development team has prioritized accessibility by providing comprehensive learning resources:
- Essential Styling: Guides on achieving consistent, professional appearance.
- Plot Cycles: Tutorials on creating reusable styling patterns.
- Configuration: Detailed documentation on customization options.
- Axis, Ticks, Legend: Specialized guides for these critical components.
- Datetime Support: Handling time-based data.
- Data Loading: Importing data from various sources.
The project is open-source and welcomes community contributions. Developers can support the project through GitHub sponsorships, ensuring continued development and maintenance.
Comparison with Alternatives
In the visualization landscape, several options exist for technical documentation:
- External plotting tools (Matplotlib, ggplot2, etc.): Require exporting images and importing into documents. Limited interactivity and inconsistent styling.
- LaTeX packages (TikZ, pgfplots): Powerful but complex syntax with a steep learning curve.
- Web-based solutions: Often require internet connectivity and may not be suitable for offline work.
Lilaq positions itself as a middle ground, offering the power of dedicated visualization tools with the seamless integration of web-based solutions, all within Typst's modern document preparation environment.
Practical Applications
Lilaq's versatility makes it suitable for numerous applications:
- Scientific research papers: Creating publication-quality figures.
- Technical documentation: Illustrating concepts with data visualizations.
- Educational materials: Developing interactive learning resources.
- Data analysis reports: Communicating findings effectively.
- Academic theses: Maintaining consistent styling across complex documents.
Future Prospects
The development of Lilaq reflects the growing maturity of the Typst ecosystem. As the library continues to evolve, we can expect:
- Additional plot types and statistical visualization capabilities
- Enhanced data import options
- Improved performance for large datasets
- Integration with more Typst libraries
- Expanded community contributions and extensions
Conclusion
Lilaq represents a significant advancement in data visualization for Typst users. By providing a native, powerful plotting solution, it addresses a critical gap in the Typst ecosystem and positions Typst as a complete document preparation system. The combination of Typst's modern typesetting capabilities with Lilaq's visualization features creates a compelling alternative to traditional document preparation workflows.
For researchers, scientists, and technical writers working with Typst, Lilaq offers an opportunity to streamline their document creation process while maintaining the highest standards of visual quality. As the library continues to develop and the Typst ecosystem grows, we can expect Lilaq to play an increasingly important role in the future of scientific and technical communication.
For more information or to contribute to the project, visit the Lilaq GitHub repository. The official documentation provides comprehensive guides and examples for getting started with the library.
Comments
Please log in or register to join the discussion